
If you're running a Melbourne engineering team, this probably feels familiar. You've got one workload in AWS, another still sitting on ageing VMware, a customer-facing app that nobody wants to touch before quarter end, and a Datadog renewal landing on your desk with enough line items to start an argument between engineering, ops, and finance.
Priya, an engineering lead at a mid-sized fintech, inherits exactly that mess. Her team wants better tracing. Security wants local assurance. Finance wants the bill under control. Ops just wants to stop guessing whether the slowdown is in the API, the database, or a queue buried behind a migration project. That's the application performance monitoring Datadog decision in Australia. It isn't “should we buy observability”. It's whether Datadog APM is the right first move for your estate, right now.
The answer depends on three things. Data residency. Contract structure. Observability maturity. If you get those wrong, Datadog becomes an expensive telemetry sink. If you get them right, it becomes a practical way to isolate regressions across browser, mobile, services, and databases before your team burns a week in incident calls.
Table of Contents
- Why Australian Teams Are Rethinking Application Performance Monitoring Datadog
- How Traces Metrics and Logs Actually Work Inside Datadog
- Datadog APM Across AWS Azure Containers and Serverless
- Datadog APM Pricing and How the Bill Actually Grows
- Instrumenting a Hybrid Australian Estate the Right Way
- IRAP Protected and What It Means for Regulated Workloads
- Sampling Retention and Cost Control That Actually Holds
- A Phased Rollout and Practical Next Steps
Why Australian Teams Are Rethinking Application Performance Monitoring Datadog
Australian buyers are looking at Datadog differently now. The old conversation was feature-led. Can it trace requests, correlate logs, and show service dependencies. That part is settled. Datadog's APM is built around end-to-end distributed tracing across browser, mobile, services, and databases, with latency distributions, percentiles, and per-service latency decomposition to isolate the tier causing slowdown, which is exactly why a delivery team can prove whether a regression sits in the frontend, API, or datastore before scaling a fix across AWS or Azure estates via Datadog APM product details.
The harder question is whether it fits Australian operating realities.
The local market says demand is real
Australia's application performance monitoring software market generated USD 77.5 million in 2024 and is projected to reach USD 202.2 million by 2030, implying a 17.8% CAGR from 2025 to 2030, with real user monitoring the largest segment in 2024 and synthetic monitoring the fastest-growing segment according to Australia APM software market figures from Grand View Research.
That tells me two things. First, local demand is already established. Second, buyers aren't just shopping for traces anymore. They're trying to monitor actual user experience across fragmented systems.
Practical rule: If your estate is still fragmented, don't start by chasing perfect trace depth. Start by deciding what telemetry must stay in-country and what you actually need to troubleshoot first.
The three issues most teams underweight
Priya's problem isn't unusual. I see the same mistakes repeatedly:
- Residency gets checked late. Teams trial the tooling first, then discover regulated workloads need a harder review of data flow, storage location, and assurance posture.
- Hybrid complexity gets ignored. A lot of Australian organisations still run a mixed estate, so cloud-only advice is incomplete. That's why I'd treat cloud computing consulting for hybrid estates as part of the observability conversation, not a separate stream.
- Host-based pricing gets underestimated. Datadog's billing model rewards discipline and punishes sprawl.
If you want a verdict up front, here it is. Datadog APM is worth it when you need cross-stack correlation, can control telemetry growth, and have a clear residency position. Skip it as a first move if your infrastructure inventory is poor, your tags are a mess, or your contract owner thinks “more data” is a cost strategy.
How Traces Metrics and Logs Actually Work Inside Datadog
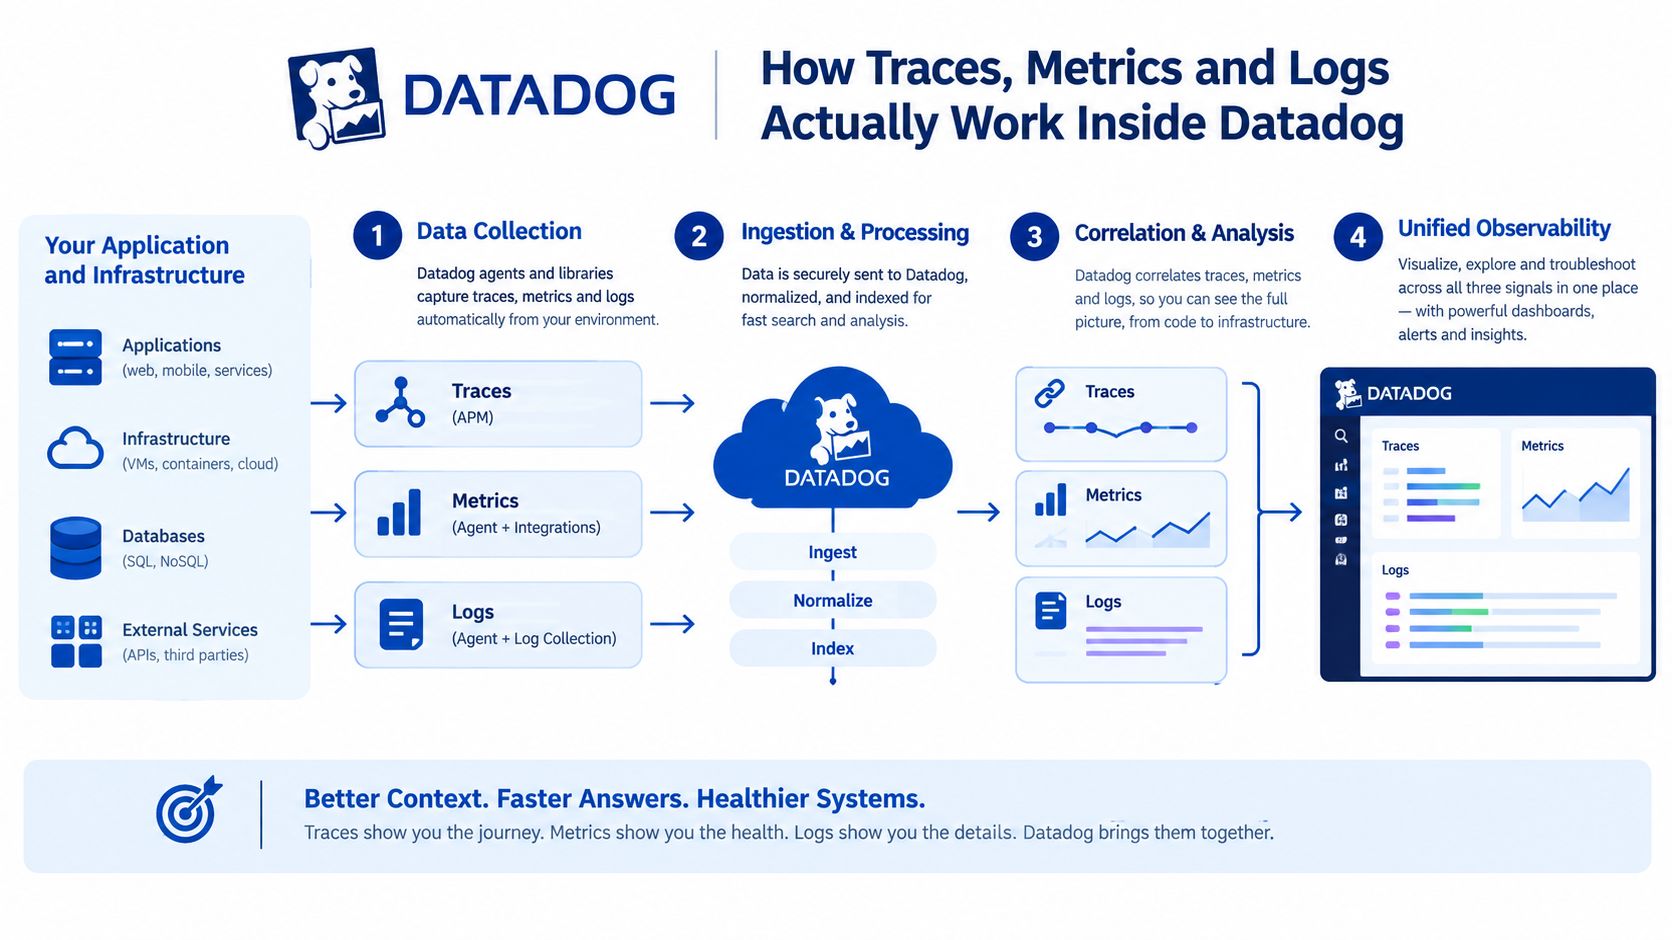
A Melbourne operations lead gets a 9:12 a.m. escalation. Checkout is slow, support has screenshots, AWS looks healthy enough, and the app team insists the database is fine. Datadog APM earns its place only if it can show the request path fast, across cloud services and the on-prem systems that still sit behind them in many Australian estates.
Take one checkout transaction. The user hits a frontend, the request reaches an API in ap-southeast-2, that service calls another service, triggers a Lambda function for fraud checks, and then reads from Aurora before responding. Datadog groups that request into a single execution trail so you can see where time was spent.
What a trace is actually showing you
A trace is the end-to-end record of one request. A span is one step inside it. Your API handler is a span. The Lambda invocation is a span. The database query is another span.
That model matters because Datadog is built to break latency into parts you can act on. You are not just told that checkout is slow. You can see whether the delay sits in application code, a downstream dependency, or the database call itself. For teams doing enterprise application monitoring and debugging, that is the difference between fixing a bottleneck and burning time on the wrong team.
How metrics are produced from traces
Datadog does not treat APM metrics as a separate stream floating beside traces. It derives service metrics such as request rate, error count, and duration from the spans it receives. If the payment service starts timing out, those trace events roll up into service-level graphs and alerts.
Use the terms precisely:
- Service map shows which services call each other. It is useful for finding hidden dependencies, especially in estates that have grown through acquisitions or partial cloud migrations.
- Ingested spans are the spans Datadog accepts into the platform.
- Indexed spans are the subset kept for deeper search, analytics, and troubleshooting.
That distinction affects cost and investigation quality. Ingest broadly and index selectively. If you do both at high volume without controls, host growth and telemetry growth combine into a bill that gets ugly quickly.
Logs help only if they line up with trace context
Logs still matter. Poorly structured logs do not.
A log tied to trace_id, service, env, and version can take an engineer from a red dashboard to the exact failing request in minutes. A flood of generic application logs with inconsistent tags does the opposite. It slows triage and drives up storage and indexing charges.
The Datadog Agent helps collect and ship telemetry, but it does not clean up weak instrumentation standards. If your teams use different service names, skip trace correlation, or dump verbose logs from every host, Datadog will faithfully ingest the mess and charge you for it.
My recommendation is simple. Standardise trace and log tags before broad rollout. Keep high-value logs. Drop noisy application chatter. In a hybrid Australian estate, that discipline matters more than another dashboard because the tool is only as useful as the telemetry model behind it.
Datadog APM Across AWS Azure Containers and Serverless
Your ops lead gets paged at 2 am. The customer impact started in AWS, the slow downstream call sits in Azure, and the root cause is still buried in an on-prem service no one wanted to instrument first. That is the test for Datadog APM. Not the product demo.
For Australian teams, platform fit matters more than feature lists. Many estates still span AWS, Azure, containers, legacy Windows, and private infrastructure. Datadog handles that mix well enough if you stay selective. It becomes expensive and noisy if you treat every runtime as equal and trace everything from day one.
AWS is the cleanest fit. ECS and EKS are usually the best starting point because service boundaries are clearer, auto-discovery is better, and distributed tracing pays off quickly during incidents. Lambda also suits Datadog because short-lived functions are painful to troubleshoot with CloudWatch logs alone.
Azure needs a stricter filter. AKS is generally fine. Functions can be worth it for business-critical workflows. App Service is where I would lower expectations, especially in estates with older .NET patterns, shared hosting decisions, or inconsistent deployment standards across teams.
On-prem containers and private platforms sit in a different category. OpenShift and Tanzu are viable, but only if you already control agent deployment, outbound connectivity, and service tagging. If you do not, fix those basics first. Buying APM before that work just gives you partial traces and a larger bill.
The practical question is not whether Datadog supports the platform. It usually does. The question is whether the workload is worth the agent, network, and instrumentation overhead in a hybrid estate where many systems still run outside public cloud.
| Platform | Best Use Case | Collection Approach | What to watch |
|---|---|---|---|
| AWS ECS and EKS | Microservices with active release cycles | Datadog Agent plus language tracers in most cases | Host growth and service sprawl can push costs up fast |
| AWS Lambda | Event-driven workloads where request flow is hard to reconstruct | Serverless instrumentation rather than a traditional host agent | Full trace depth on every function can create more telemetry than you need |
| Azure AKS | Containerised apps with clear ownership | Agent plus tracer setup for correlation | Works well, but consistency depends on engineering standards |
| Azure Functions | Targeted tracing for important workflows | Function-level instrumentation | Good for key paths, poor candidate for blanket rollout |
| Azure App Service | Selected apps with modern codebases | Setup varies by runtime and deployment model | Older app patterns often produce uneven traces |
| OpenShift or Tanzu on-prem | Services that bridge cloud and private infrastructure | Agent rollout on nodes and disciplined tracer config | Network egress, patching, and operational ownership matter more here |
| Legacy .NET Framework on IIS | High-value applications only | Often agent plus extra runtime-specific work | Easy to underestimate effort and support overhead |
Start with workloads that already have clean service boundaries and real incident cost. Skip broad rollout across old IIS estates unless the application is commercially important or sits directly in a critical transaction path. Datadog can trace them, but the effort-to-value ratio is often poor compared with modern container platforms.
If you are reviewing AWS-heavy application estates, architecture is the better predictor of APM success than vendor diagrams. Teams planning modern service layouts can use AWS hosting patterns for membership platforms as a practical reference for where tracing effort stays manageable and where it becomes messy.
My recommendation is simple. Start with AWS containers, add serverless only for business-critical flows, treat Azure App Service cautiously, and bring on-prem platforms in only after you have agent standards, egress rules, and ownership in place. In Australian environments, that sequencing matters. It keeps hybrid complexity under control and stops host-based billing from punishing unmanaged growth.
Datadog APM Pricing and How the Bill Actually Grows
A Melbourne ops team rolls Datadog APM into production, proves value in a week, then gets the first serious invoice a month later. The surprise is rarely tracing itself. It is host growth, duplicate environments, and poor discipline around what gets retained and searched.
Datadog's published APM pricing is straightforward on paper. Annual list pricing is $31 per host per month for APM, $35 for APM Pro, and $40 for APM Enterprise. On-demand pricing is higher at $36, $42, and $48. Datadog also sells APM without Infrastructure Monitoring, as shown on Datadog pricing.
For Australian buyers, that host-based model matters more than the headline tier. If your estate is still mostly on-prem or hybrid, and many local estates are, agent coverage expands into VMware clusters, Windows fleets, and test environments faster than cloud-native teams expect. After Datadog's 2025 IRAP Protected assessment, residency and regulated use cases are easier to discuss internally. Cost control still depends on how many billable hosts you let into scope.
The core tiers in plain English
| Feature | APM | APM Pro | APM Enterprise |
|---|---|---|---|
| Annual list price per host per month | $31 | $35 | $40 |
| On-demand price per host per month | $36 | $42 | $48 |
| Standalone purchase option | Yes | Yes | Yes |
| Included indexed spans per APM host per month | Included | Included | Included |
| Included ingested spans per APM host per month | Included | Included | Included |
Datadog includes indexed and ingested span allowances with each APM host. The practical point is simple. You are paying for host coverage first, then paying again when weak sampling and retention choices create more searchable data than the team uses.
Why bills rise faster than expected
Three patterns drive most overruns.
- Host count expands. Autoscaling groups, DR environments, short-lived test stacks, and half-finished hybrid rollouts all add billable coverage.
- Indexed spans get expensive when teams retain everything. Keep full-fidelity search for revenue paths, auth, checkout, and integration failures. Do not index every low-value internal call.
- Other products get blamed on APM. Logs, synthetics, RUM, and profiler usage often push the total higher than tracing does.
The main constraint is the agent footprint. In Australian estates with a large on-prem base, that is where Datadog stops looking lightweight and starts looking like a platform decision. Every extra server class you instrument needs ownership, tagging standards, and a removal process when workloads move or die.
Billing mechanics also catch buyers out. Datadog measures APM host usage hourly and bills against a monthly high-water approach that smooths brief spikes rather than charging every peak hour in full, as described in Datadog billing and pricing documentation. That helps with bursty workloads. It does not protect you from a permanently growing fleet.
Cost warning: Host-based APM punishes unmanaged growth. If nobody owns tags, retention, and host lifecycle, finance will spot the observability problem before engineering fixes it.
My recommendation on contracts
Do not sign annual APM at scale until you have measured host behaviour for your real estate, not the vendor demo version of it. Run a pilot. Count production hosts, non-production hosts, autoscaling variance, and every on-prem segment likely to be added once one team gets value and the rollout spreads.
Then set controls before procurement locks in the spend. Require environment tags. Exclude dead and duplicated services. Set indexing rules around business-critical flows only. Many of the same hygiene failures behind common AWS cost and architecture mistakes SMEs make show up again in Datadog invoices.
My advice is blunt. Pay for coverage where incidents hurt the business. Skip broad APM rollout across low-value internal systems until you have clear owners, sampling rules, and a hard view of monthly host growth.
Instrumenting a Hybrid Australian Estate the Right Way
It is 2:10 am. Checkout is slow, the customer app is timing out, and your cloud dashboards look healthy because the fault sits on an on-prem integration server nobody instrumented properly. That is the Australian hybrid problem in plain terms. If much of your estate still runs across data centre racks, branch networks, private VMware, and cloud services, Datadog APM only helps if you roll it out in the right order.
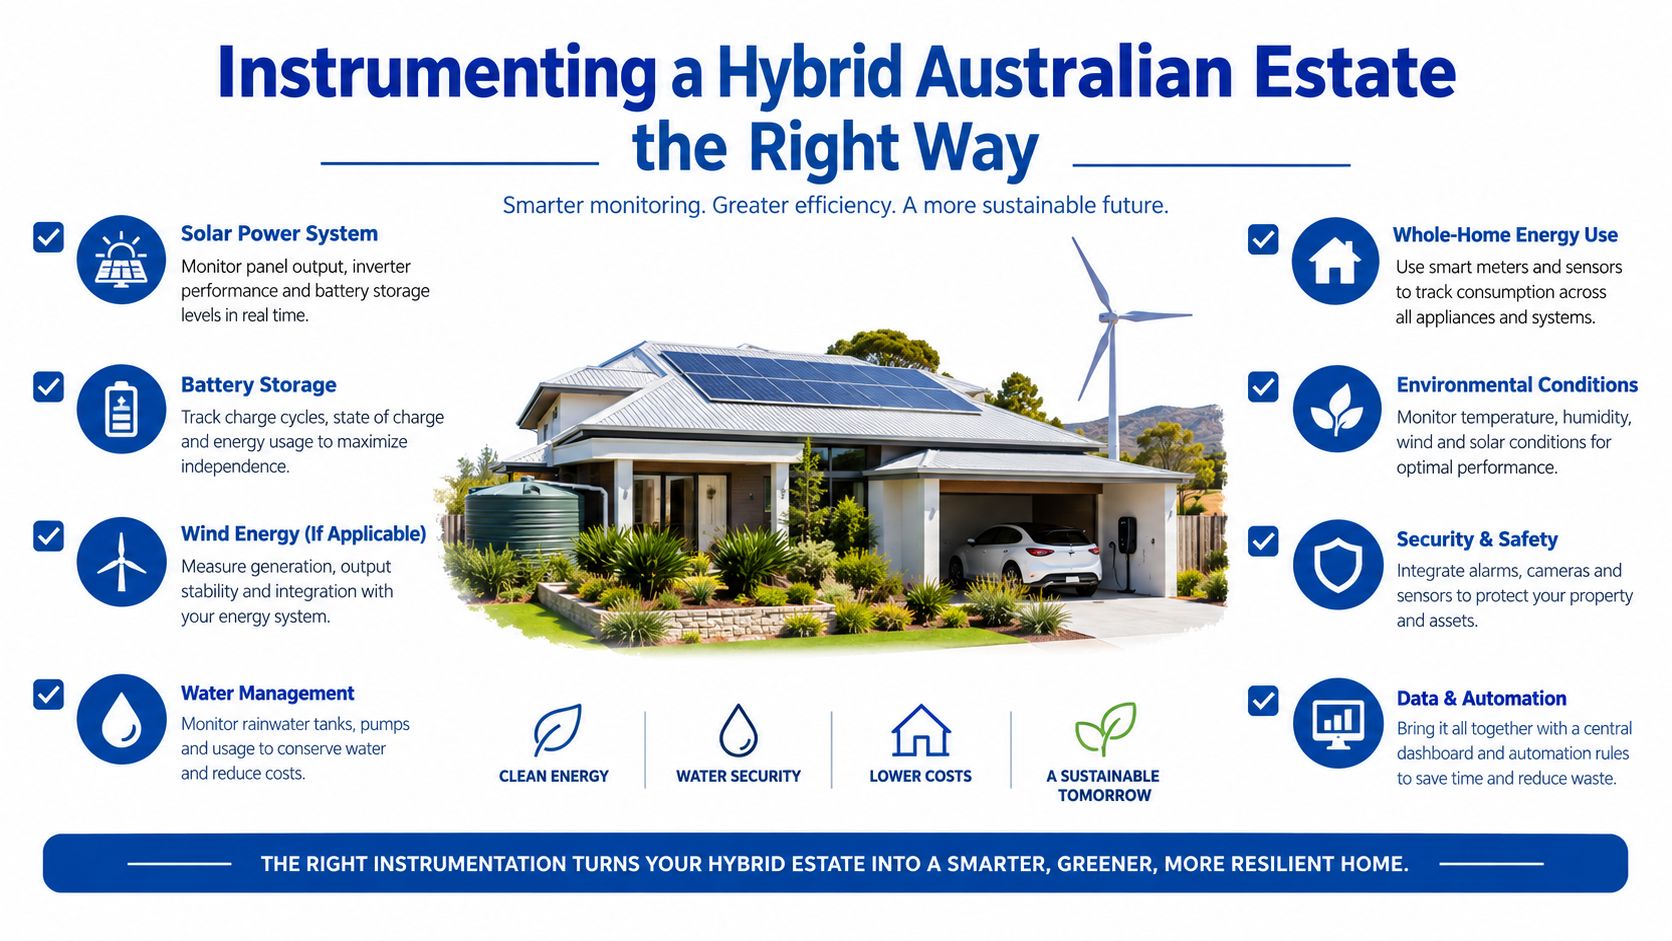
My recommendation is simple. Start with operational coverage across the estate, then add tracing where incidents cost real money. Do not begin with blanket instrumentation across every app, cluster, and batch job. In Australian environments, that approach usually creates noise, misses the on-prem dependencies that still matter, and pushes host-based APM costs up before teams have ownership in place.
Start with dependency visibility
Your first target is service path visibility across on-prem and cloud boundaries. You need to know which applications call what, where latency is introduced, and which old internal systems still sit in the request path. If you skip that step and jump straight into code-level tracing, you will instrument the easy cloud services and miss the actual bottlenecks.
Use this rollout order:
- Deploy the agent baseline on servers first. Cover Linux and Windows across data centre, private cloud, and public cloud so you can see host health, process activity, and network dependencies.
- Normalise tags before scale. Set
env,service,team, and cost-centre tags early or you will lose accountability fast. - Add container and orchestrator visibility. Bring Kubernetes, ECS, or other runtime layers into the same view once host naming and ownership are clean.
- Trace the business-critical paths only. Instrument the applications tied to revenue, customer access, contact centres, warehousing, field operations, or regulated workflows.
- Expand from proven service chains. After one path is stable end to end, add the next one.
That sequence fits local reality. Roughly 85 percent of workloads in many Australian estates still sit outside a pure-cloud model, so your instrumentation plan must handle mixed infrastructure instead of assuming every dependency already lives in AWS or Azure.
The controls I would set on day one
Hybrid instrumentation breaks on basic operational mistakes, not on missing features. Set the controls first.
- Use a controlled egress path. Document where telemetry leaves the environment and who owns that route.
- Fix time sync everywhere. Traces become unreliable when on-prem and cloud clocks drift.
- Tag ownership clearly. Every service needs an owner, environment tag, and cost mapping.
- Limit language tracer rollout. Start with the few Java, .NET, Python, or Node services that matter most to the business.
- Test failover paths. Hybrid incidents often surface during DNS changes, VPN degradation, or private link issues, not during normal traffic.
- Run a contained pilot. Two weeks on one application is enough to prove whether teams can use the data during a real fault.
One more point matters for Australian buyers after the 2025 IRAP Protected assessment. Residency and assurance change the shortlist, but they do not fix poor rollout discipline. You still need to decide which workloads can send traces, logs, and metadata, which ones need tighter handling, and which legacy systems are not worth full APM coverage at all.
A lot of migration programs get this wrong. Monitoring is treated as a post-cutover task, then the team discovers blind spots during hypercare. If you are still shifting core platforms, cloud migration services for phased estates should be tied directly to your observability plan, because instrumentation order affects both cutover risk and support effort after go-live.
What to skip in the first pilot
Skip vanity dashboards. Skip full-trace retention across low-value services. Skip broad log ingestion from every legacy node. Skip instrumenting old internal apps that rarely change and have no material business impact.
Get one important application visible from user-facing entry point to backend dependency. Make sure the owning team can isolate a fault quickly, correlate it with infrastructure signals, and decide whether wider rollout is worth the spend.
IRAP Protected and What It Means for Regulated Workloads
A Melbourne operations team signs off on Datadog for a regulated service, assumes the IRAP Protected milestone settles the hard questions, then finds out risk sits in telemetry scope, cross-environment routing, and cost growth across a hybrid estate. That is the Australian buying reality. Assurance gets Datadog onto the shortlist. It does not tell you which systems should send traces, where that data should live, or how fast host-based billing will spread if you instrument without discipline.
Datadog has been covered in Australian industry reporting as having completed an IRAP assessment at the Protected level in Australia. That matters because regulated buyers can now assess APM, logs, and user experience monitoring with a local assurance baseline, as reported by GovTech Review on Datadog's IRAP assessment in Australia.
Use that milestone correctly. Treat it as a procurement and architecture filter.
For Commonwealth agencies, government contractors, health, education, and critical infrastructure operators, IRAP Protected changes the approval path. Security teams have a stronger basis to consider Datadog for workloads that previously stalled on assurance and residency questions. That is useful, especially if you need one operating model across cloud services and the on-prem systems that still make up most of the estate in Australia.
It does not remove the design work. You still need to map exactly which traces, logs, tags, and service metadata leave each environment. You still need to review identity boundaries, key handling, network egress, access paths for support teams, and the contract terms that govern residency and processing. In hybrid estates, that review matters more because the riskiest systems are often the least modern and the hardest to instrument cleanly.
My recommendation is blunt. Do not use IRAP Protected as a reason to roll full APM across every regulated workload. Start with the services where faster fault isolation has a clear operational payoff, then keep highly sensitive or low-change legacy systems on tighter telemetry settings, or out of full APM entirely if the cost and exposure are not justified.
Read the assessment scope before renewal. Check what is covered, what is customer-managed, and which controls still sit with your team. Then get security, platform, and application owners to approve the same data-flow diagram. If those three groups cannot agree on telemetry boundaries, you are not ready to expand coverage.
Sampling Retention and Cost Control That Actually Holds
A Melbourne ops team rolls Datadog APM from a few services to a mixed estate, then gets the first unpleasant surprise a month later. The incident workflow is better, but the bill jumps because extra hosts, noisy services, and default retention settings slipped in without anyone owning them. That is the Australian Datadog problem in plain terms. APM can help fast, but host-based billing punishes unmanaged growth, especially in hybrid estates where on-prem systems still outnumber the clean cloud-native stack.
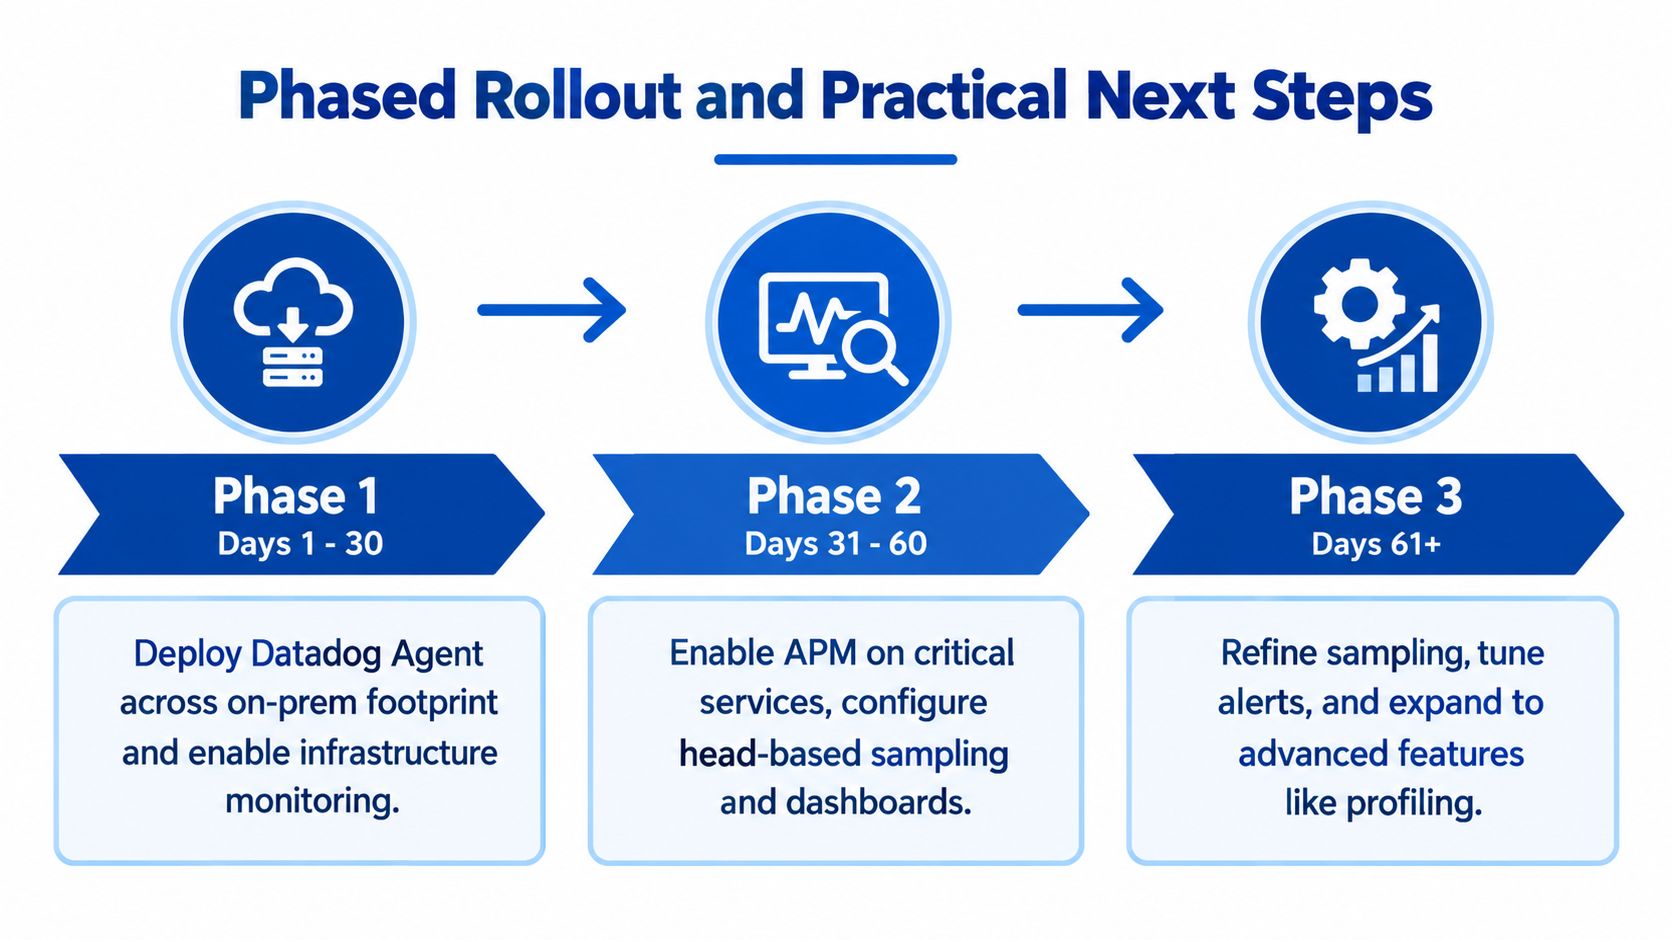
The fix is simple. Treat sampling, retention, and host coverage as financial controls, not just observability settings.
Four controls that actually last
I recommend four controls because they survive beyond the pilot phase and still work once dozens of teams are shipping telemetry.
- Sample by business risk: Keep high trace fidelity for checkout flows, patient systems, payment paths, customer logins, error conditions, and new releases. Sample aggressively on low-risk background jobs and routine internal traffic.
- Set retention by investigation window: Keep short-lived high-detail data for active troubleshooting. Keep only the lower-cost history that supports trend review, service reviews, and audit needs.
- Drop low-value noise early: Exclude health checks, cron chatter, internal pings, and repetitive infrastructure spans before they inflate indexed volume and distract engineers.
- Charge back to service owners: Put monthly ingestion, indexed spans, and host growth in front of the team that owns the service. Central platform teams should set guardrails, but they should not be the only team watching the meter.
Skip the fantasy that every trace is worth keeping. It is not.
What to control first
For Australian buyers, three cost drivers matter more than people expect.
First, host count grows quietly in hybrid estates. A few extra VMs, short-lived test nodes, forgotten agents on legacy servers, and duplicated coverage across on-prem and cloud can push spend up before trace volume becomes the main issue.
Second, retention defaults are rarely aligned to operational value. Teams often keep too much detail for too long because no one forced a decision.
Third, unmanaged tagging creates waste. If service names, environments, and ownership tags are inconsistent, you cannot see who is driving cost or which telemetry is safe to cut.
The trade-off worth making
You will lose some low-priority traces. Good. The point is faster triage on the transactions that matter, with a bill that does not blow out every quarter.
I also recommend a hard review every month for the first quarter. Check host growth, indexed span volume, top noisy services, and retention settings by environment. If a service owner cannot explain why their telemetry volume doubled, cut it back.
External help can be useful if the internal platform team is already buried. Continuum Solutions is one option for organisations that need support setting observability guardrails, sequencing cloud migration work, and instrumenting applications without letting telemetry sprawl turn into an open-ended cost problem.
A Phased Rollout and Practical Next Steps
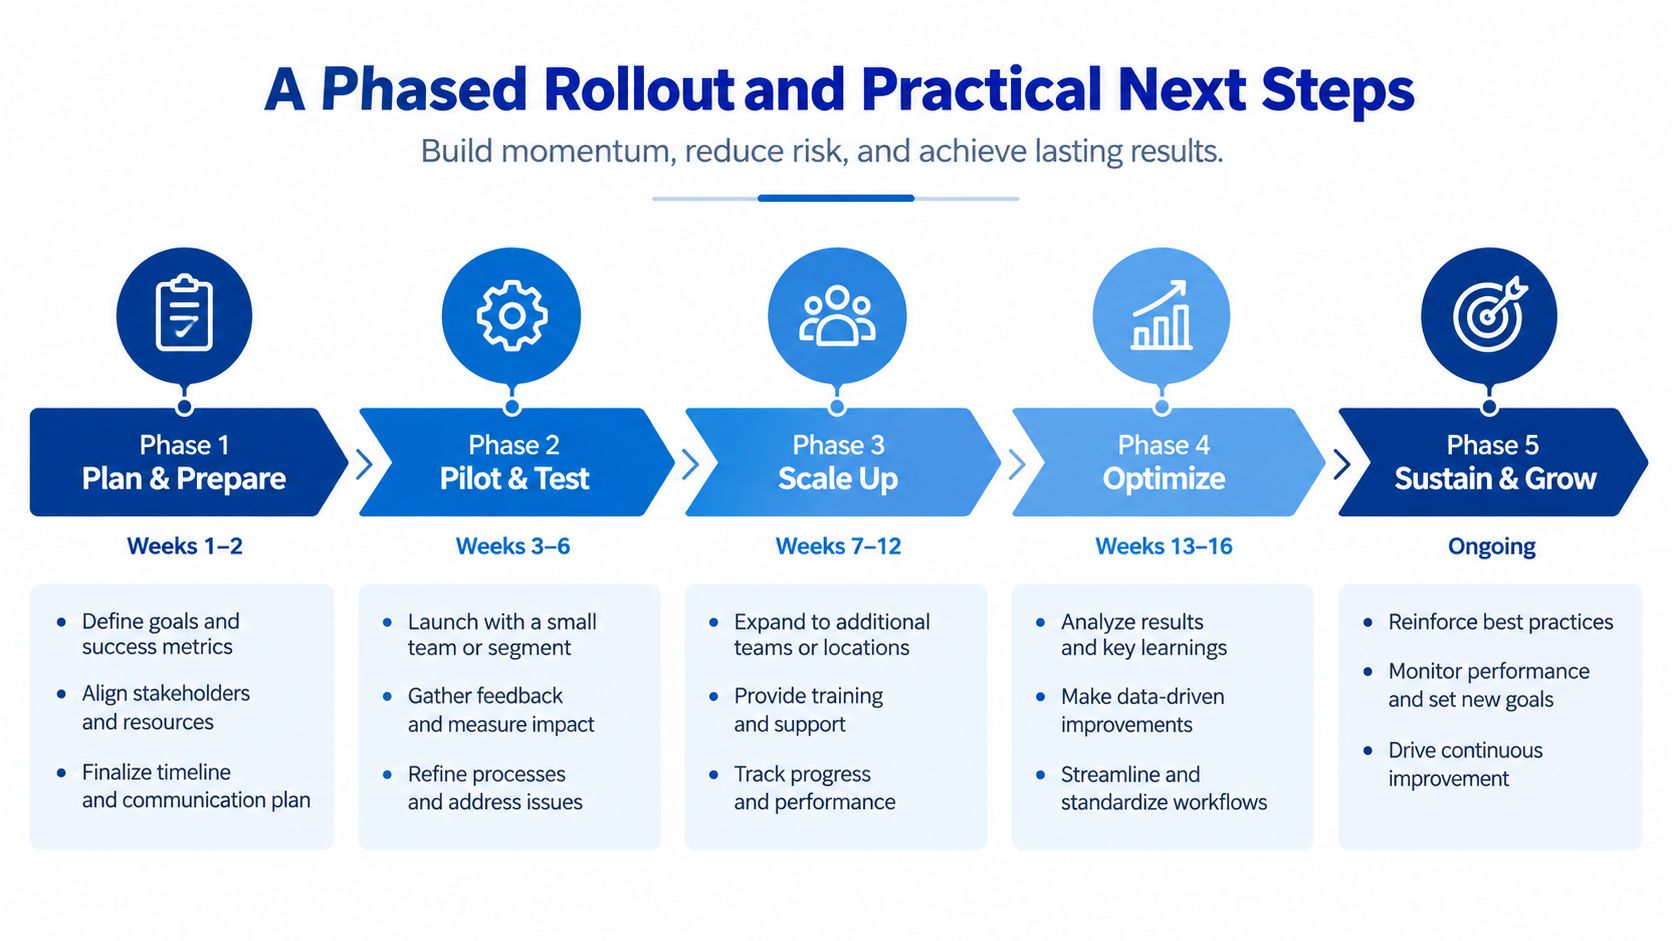
The cleanest Datadog rollouts in Australia aren't the most ambitious ones. They're the ones with a narrow first scope, explicit exit criteria, and cost controls set before the platform spreads.
Days 1 to 30
Start with estate visibility. Deploy the Datadog Agent across the on-prem footprint you care about, enable infrastructure metrics, and map hosts to billing and ownership tags.
Exit criteria at this stage should be basic but strict:
- Known inventory: You can identify which hosts and services are reporting.
- Tag discipline: Environment and ownership tags are visible and consistent.
- Initial residency view: You have a documented understanding of where telemetry is flowing.
Days 31 to 60
Pick one business-critical API and instrument it end to end. Use OpenTelemetry or native instrumentation where it makes sense, then validate that traces, logs, and service naming line up in the same investigation workflow.
At this stage I'd expect:
- One closed-loop incident review: The team used the data to investigate a real issue.
- Sampling rules in place: You're no longer collecting blindly.
- Cost ceiling documented: Someone owns the monthly spend threshold and knows what triggers review.
Decision test: If your first traced application still can't answer “where did the latency come from” within minutes, stop expanding and fix your correlation model first.
Days 61 to 90
Extend to the second workload only after the first is stable. If any service touches regulated data, review whether the IRAP-assessed scope and your own controls align with how telemetry is captured and routed.
Keep three artefacts beside the dashboard:
- Span inventory listing what each critical service emits.
- Tag governance matrix defining owner, environment, and cost attribution.
- Quarterly cost review cadence with platform and finance both in the room.
The teams that do this well treat application performance monitoring Datadog as an operating model, not a product switch. That's the difference between useful observability and another expensive platform everyone complains about at renewal time.
If your team is weighing Datadog APM against hybrid complexity, residency requirements, and rising cloud costs, Continuum Solutions can help map the rollout properly, instrument the right services first, and put cost controls around the platform before it sprawls. We work across AWS, Azure, migrations, and application observability for Australian organisations that need practical implementation, not another slide deck. Visit Continuum Solutions if you want a grounded review of your current estate and a phased monitoring plan that fits it.