
At 11pm Sydney time, a payment page starts taking several seconds to respond. The infrastructure dashboard is green. CPU looks normal, the load balancer is healthy, and no deployment has failed. Support tickets start climbing while the on-call engineer tries to determine whether the delay sits inside the application, an identity provider, a payment gateway, or the carrier route reaching Australian users.
That is the operational problem application performance monitoring, or APM, is meant to solve. APM instruments application code and its runtime so teams can see, measure and troubleshoot how software behaves under real user demand. It connects technical evidence to the customer journey, rather than treating an application as a collection of healthy servers.
For a CTO, APM belongs in the stack when application reliability affects revenue, service delivery, reputation or compliance. It isn't a substitute for good architecture, capacity planning or incident management. It is the evidence layer that tells you what happened and where to act. Teams reviewing their cloud architecture should also account for the common AWS mistakes SMEs make, because monitoring can't compensate for unclear ownership, fragile dependencies or poorly designed failure paths.
Table of Contents
- Why Application Performance Monitoring Matters Now
- Traces Metrics and Logs Explained Simply
- Core APM Capabilities Worth Knowing
- Latency Throughput Error Rate and Apdex
- APM Compared With Logging and Observability
- Common Tools and Cloud Integration Patterns
- Implementation Checklist and Best Practices
- Cost ROI and What to Do Next
Why Application Performance Monitoring Matters Now
Distributed applications have made the old definition of “up” almost useless. A website can return a successful HTTP response while a customer waits for an identity token, a database connection, a third-party API, or a mobile network route. Uptime alone won't tell you whether the payment journey is usable.
Australian organisations already treat APM as a mainstream operational capability. New Relic's Australia and New Zealand research found that 53% of Australian organisations had deployed APM, while 35% had achieved full-stack observability by 2023, according to coverage of the 2023 observability forecast. The same research reported a median annual outage cost of more than AUD 11 million for Australian organisations, and 42% said critical business outages cost at least AUD 390,000 per hour. Those figures make reliability an executive concern, not an isolated engineering preference.
My working rule: if a customer, employee, member or citizen depends on a digital journey, monitor the journey, not just the infrastructure underneath it.
The Australian context adds another layer. The Digital Transformation Agency's Digital Performance Standard, effective 1 January 2025, requires Australian government digital services to implement a monitoring framework, measure availability, measure success, measure customer need, and analyse and report performance through its official standard. APM data can support that evidence, but only if teams map telemetry to service outcomes instead of collecting disconnected charts.
The difficult incidents are increasingly cross-domain. A carrier outage, cloud dependency, identity provider, certificate issue, queue backlog or external integration can produce the same customer symptom as a code defect. The rest of the stack matters because APM must help answer a commercial question: which part of the service failed, how many users were affected, and what evidence supports the response?
Traces Metrics and Logs Explained Simply
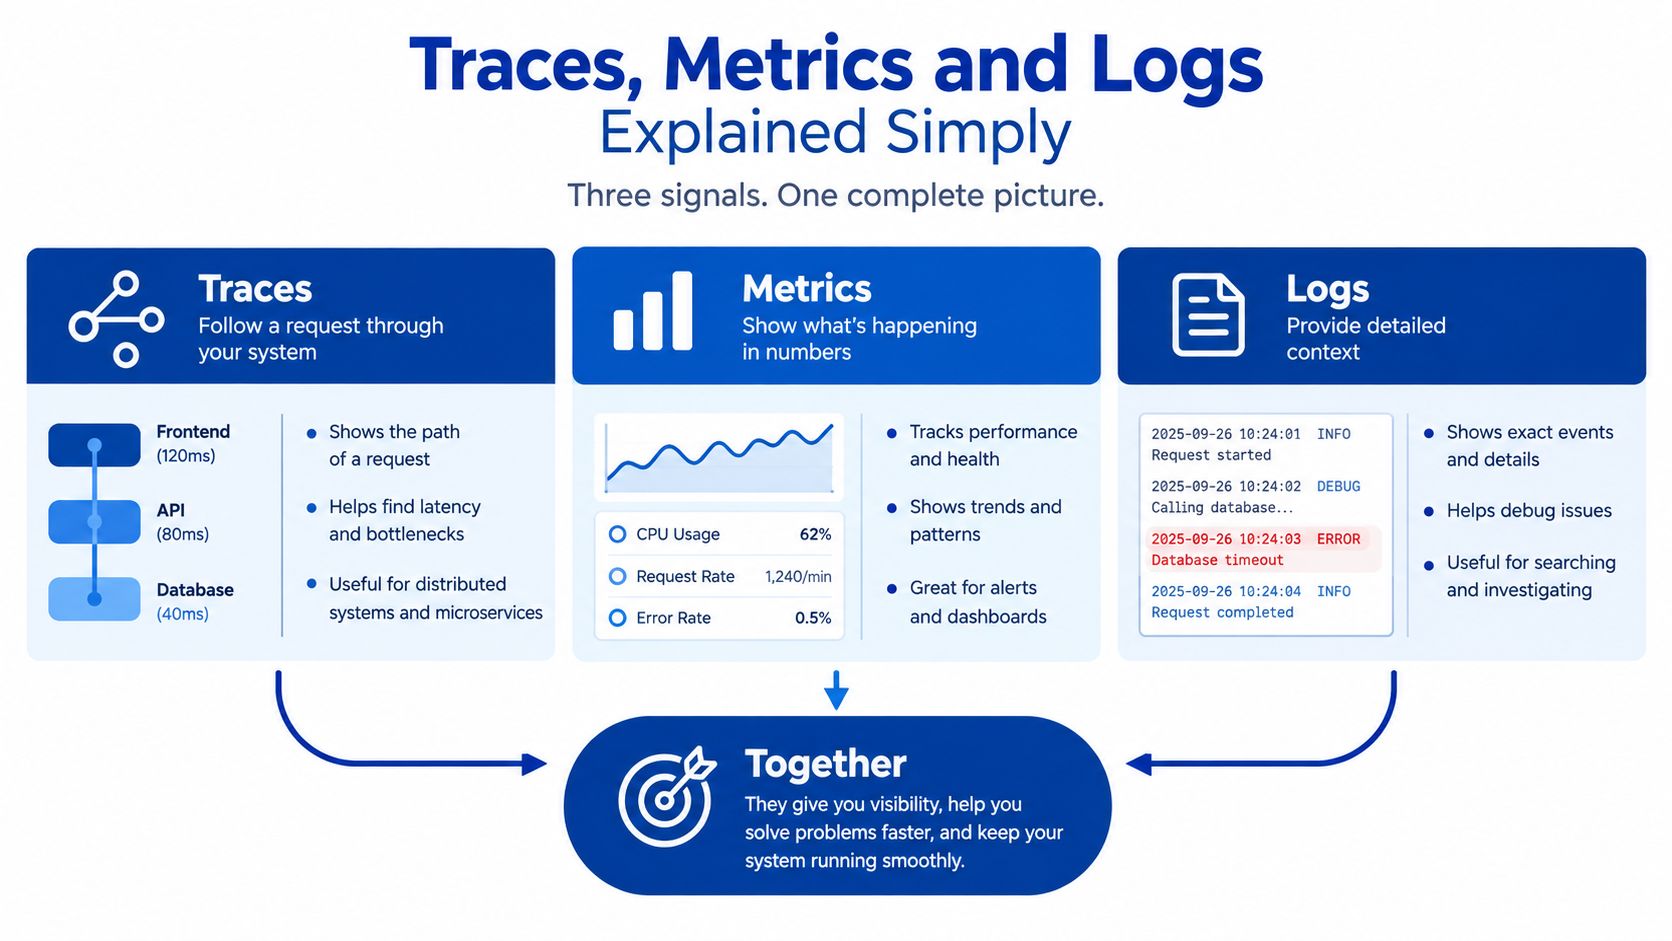
A payment request leaves behind three useful layers of evidence. Start with metrics because they provide the cheapest, most consistent heartbeat of the service.
Suppose a customer submits a payment. Metrics record how many payment requests arrived, how long they took, how many failed, and how much work the service completed during the period. A dashboard might show that request latency has risen, but it won't explain whether the delay came from the checkout service, the database or the payment processor.
A trace follows one transaction through that path. The application assigns a correlation identifier, then records spans for each operation, such as loading the basket, checking stock, requesting an identity token, calling the payment gateway and writing the order. If the whole checkout took 1,400 milliseconds, the trace can show that the application used little time while an external authorisation call consumed most of the request.
Logs provide the detailed narrative around those operations. A structured log might record that the payment gateway rejected a request, that a token was missing, or that a database transaction rolled back. Logs are rich, but they can be expensive to store and difficult to interpret without the trace and metric context that tells you which events matter.
Match the signal to the question
- Metrics answer whether a pattern exists: Did checkout latency increase? Did error volume rise? Is throughput falling?
- Traces answer where the transaction spent time: Which service, query or external call created the delay?
- Logs answer what happened in context: What did the application record when the request failed?
I normally instrument the most valuable journey first, then make every log line carry the relevant trace identifier. That lets an engineer move from an alert to a representative trace, then from the slow span to the exact application event. Guidance on enterprise application monitoring and debugging follows the same principle, connect measurement to diagnosis rather than adding another isolated dashboard.
Core APM Capabilities Worth Knowing
APM platforms often bundle several capabilities, but they don't serve the same purpose. Choosing by brand first is a mistake. Choose by the failure questions your team needs to answer.
Transaction tracing is the strongest starting point for backend diagnosis. It follows a request across services and identifies the slow database query, queue operation or external API call. For a modern checkout, tracing shows whether the problem is in the web application or in a dependency the application calls.
Real-user monitoring, or RUM, measures actual browser and mobile sessions. It captures the experience associated with a device, geography and network, so a frontend regression or regional connectivity problem can appear before your support team understands the pattern. RUM is especially useful when infrastructure metrics look normal but customers report slow screens.
Synthetic monitoring runs controlled checks against important journeys from outside the application. A scheduled login, search or payment test can expose an outage, certificate problem, DNS failure or broken dependency when few real users are active. It gives compliance and uptime programmes a repeatable external record.
Error tracking groups exceptions and attaches stack traces, release markers and affected-user context. It helps product engineers prioritise defects, but it doesn't replace transaction tracing. A grouped exception may tell you what failed, while a trace tells you how that failure affected the customer journey.
| Capability | Primary Signal | Best For | Typical Owner |
|---|---|---|---|
| Transaction tracing | Request path and span duration | Distributed backend diagnosis | DevOps or software engineering |
| Real-user monitoring | Actual browser and mobile experience | Frontend and device-specific regressions | Product and frontend teams |
| Synthetic checks | Controlled external journeys | Availability, certificates and critical paths | Operations or service owners |
| Error tracking | Exceptions and stack traces | Release defects and code triage | Product engineering |
Teams chasing silent backend regressions should prioritise tracing. Customer-facing product teams need RUM. Compliance and uptime programmes should add synthetic checks. Product engineers usually get immediate value from error tracking, provided someone connects it to release and user-impact data.
Latency Throughput Error Rate and Apdex
A CTO rarely asks for “more telemetry”. During an incident, the useful questions are simpler: How slow is it? How much work is getting through? What is failing? Are users satisfied?
Latency answers the first question. Don't rely on an average. Averages hide the customers at the slow end of the distribution, so track p50 for the typical experience, p95 for the slower cohort, and p99 for the tail that often exposes dependency or capacity problems.
Throughput measures completed work over time. For a payment service, that means more than incoming requests. You need to know how many payment attempts reached the processor, how many orders were created, and whether a downstream processor throttled requests.
Error rate must include business failures, not only server errors. A declined card, failed identity check or rejected integration can return a technically valid response while still breaking the customer's intended task.
Apdex converts response-time categories into a satisfaction score from 0 to 1. It uses satisfied, tolerating and frustrated response-time thresholds, which can make a service-level report easier for non-technical stakeholders to interpret. I treat it as a useful summary, not a replacement for percentile latency and business success measures.
Australian geography also changes the target. The ACCC defines latency as the time a packet takes to travel between two points and includes webpage load times, DNS response times, packet loss and jitter among relevant monitoring measures. Its broadband guidance notes that services hosted outside Australia can create significantly higher latency, while Australian-hosted services generally provide better application performance, as explained in this Australian latency measurement coverage.
| Metric | CTO Question | Common Pitfall | Example Target |
|---|---|---|---|
| Latency | How slow does the journey feel? | Using an average that hides tail pain | A defined p95 for checkout |
| Throughput | How much completed work is getting through? | Counting requests instead of successful outcomes | Successful payments per service interval |
| Error rate | Which technical and business attempts fail? | Excluding declined or rejected business flows | Failed payment attempts within the agreed limit |
| Apdex | How many users are satisfied, tolerating or frustrated? | Treating the score as a full diagnosis | A service-level satisfaction threshold |
Targets must come from the service contract and user journey, not a vendor default. A payment flow with a fast page but a slow authorisation dependency is still a slow payment flow. The same discipline applies when reviewing whether an application is production ready.
APM Compared With Logging and Observability
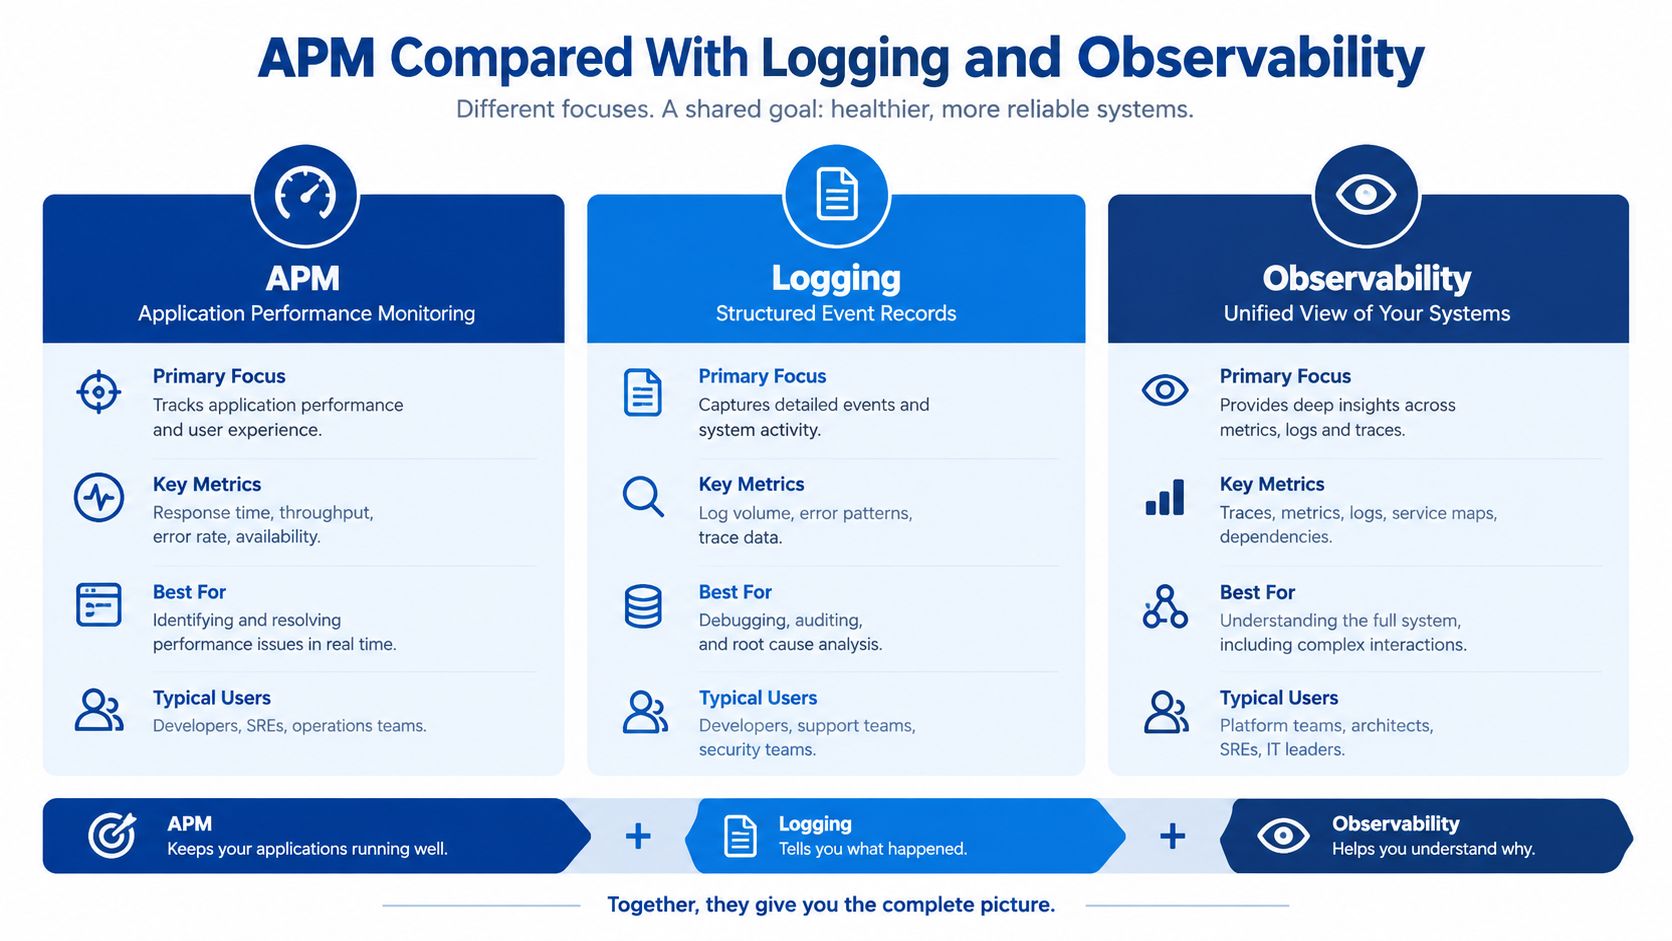
APM, logging and observability overlap, but buying all three without defining their scope creates unnecessary cost.
APM is application-centric. It is usually pre-instrumented around known services, endpoints, transactions and dependencies. It helps a team identify a slow request or broken endpoint quickly because the platform already understands the application path.
Logging is event-centric. It records detailed application and operational events, making it valuable for forensic work, audit trails and unusual business conditions. Logs don't automatically reveal user impact or dependency relationships. A large collection of unstructured logs can leave an engineer searching for the one event that matters.
Observability is broader. It combines metrics, traces, logs and related signals so a team can investigate failure modes it didn't predict in advance. That distinction matters once microservices, queues, networks and third-party APIs dominate the architecture. A request may look healthy at the application layer while a queue consumer, carrier or identity service creates the underlying delay.
Buy the layer your architecture needs
APM earns its keep fastest in a stable request-response application where owners need rapid diagnosis. Logging deserves investment when the organisation needs a reliable event record, detailed business context or audit evidence. Broader observability becomes necessary when the failure surface crosses services, networks, cloud providers and external systems.
Australian digital-government guidance makes the combined approach practical rather than theoretical. Teams need to correlate frontend experience with backend services, hosts, logs, networks and end users to resolve failures across mobile apps, websites and business applications, as described in guidance on IRAP-protected observability.
APM tells you that a known application path is unhealthy. Observability helps you investigate why an unfamiliar combination of dependencies produced that result.
Don't over-buy a full platform for a small monolith with one service owner and modest traffic. Don't under-buy with isolated log search once your organisation operates asynchronous workflows and external integrations. The correct scope follows the architecture and the cost of uncertainty.
Common Tools and Cloud Integration Patterns
Tool selection should follow ownership, cloud estate and data-handling requirements. Sentry is a pragmatic front door for error tracking, particularly for frontend and mobile teams that need release-aware exceptions and user-impact context. New Relic and Datadog suit organisations seeking broad APM and observability across applications, infrastructure, real users and incident response.
Oracle APM is more relevant to a legacy estate built around Oracle technologies such as E-Business Suite or WebLogic than to a greenfield AWS application. Oracle's Australian APM page describes distributed tracing and availability monitoring for application components, and states that the service is always free in that offering, as shown on Oracle's Australian APM product page.
AWS teams can use AWS X-Ray or OpenTelemetry-based collection, while Azure estates can use Azure Application Insights or OpenTelemetry paths. The important architecture decision is where telemetry is processed and stored. Australian government and regulated workloads may need a deployment that aligns with local security controls, contractual obligations and data-residency expectations. Confirm those requirements before agents begin exporting traces and logs.
| Tool | Primary Strength | Best Fit | AWS Integration | Azure Integration | Data Residency Note |
|---|---|---|---|---|---|
| Sentry | Error tracking and release diagnostics | Startups and frontend or mobile teams | SDKs and hosted integrations | SDKs and hosted integrations | Confirm storage location and retention |
| New Relic | Broad APM and observability | Enterprises standardising telemetry | Cloud integrations and OpenTelemetry | Cloud integrations and OpenTelemetry | Review regional account and data controls |
| Datadog | Full-stack monitoring and correlation | Multi-service enterprise estates | AWS service integrations and agents | Azure integrations and agents | Check regional processing and governance |
| Oracle APM | Oracle application tracing | Oracle-heavy legacy environments | Suitable where Oracle workloads are hosted on AWS | Suitable where Oracle workloads are hosted on Azure | Validate tenancy and regulatory requirements |
Splunk states that its observability platform in Australia and New Zealand collects metrics, traces and logs in real time without sampling and at scale, with capabilities including infrastructure monitoring, RUM, synthetic monitoring, log investigation and incident response, according to Splunk's Australia and New Zealand announcement. Continuum Solutions also provides application monitoring and debugging using Sentry and New Relic, alongside AWS and Azure architecture work. For a membership platform, the AWS hosting approach for membership platforms should include observability boundaries, not just compute and storage.
For an NGO, I favour OpenTelemetry with a deliberately small backend and disciplined retention. For a startup, Sentry plus focused uptime and transaction monitoring is often enough initially. For a regulated enterprise, select the platform only after security, residency, retention and integration reviews.
Implementation Checklist and Best Practices
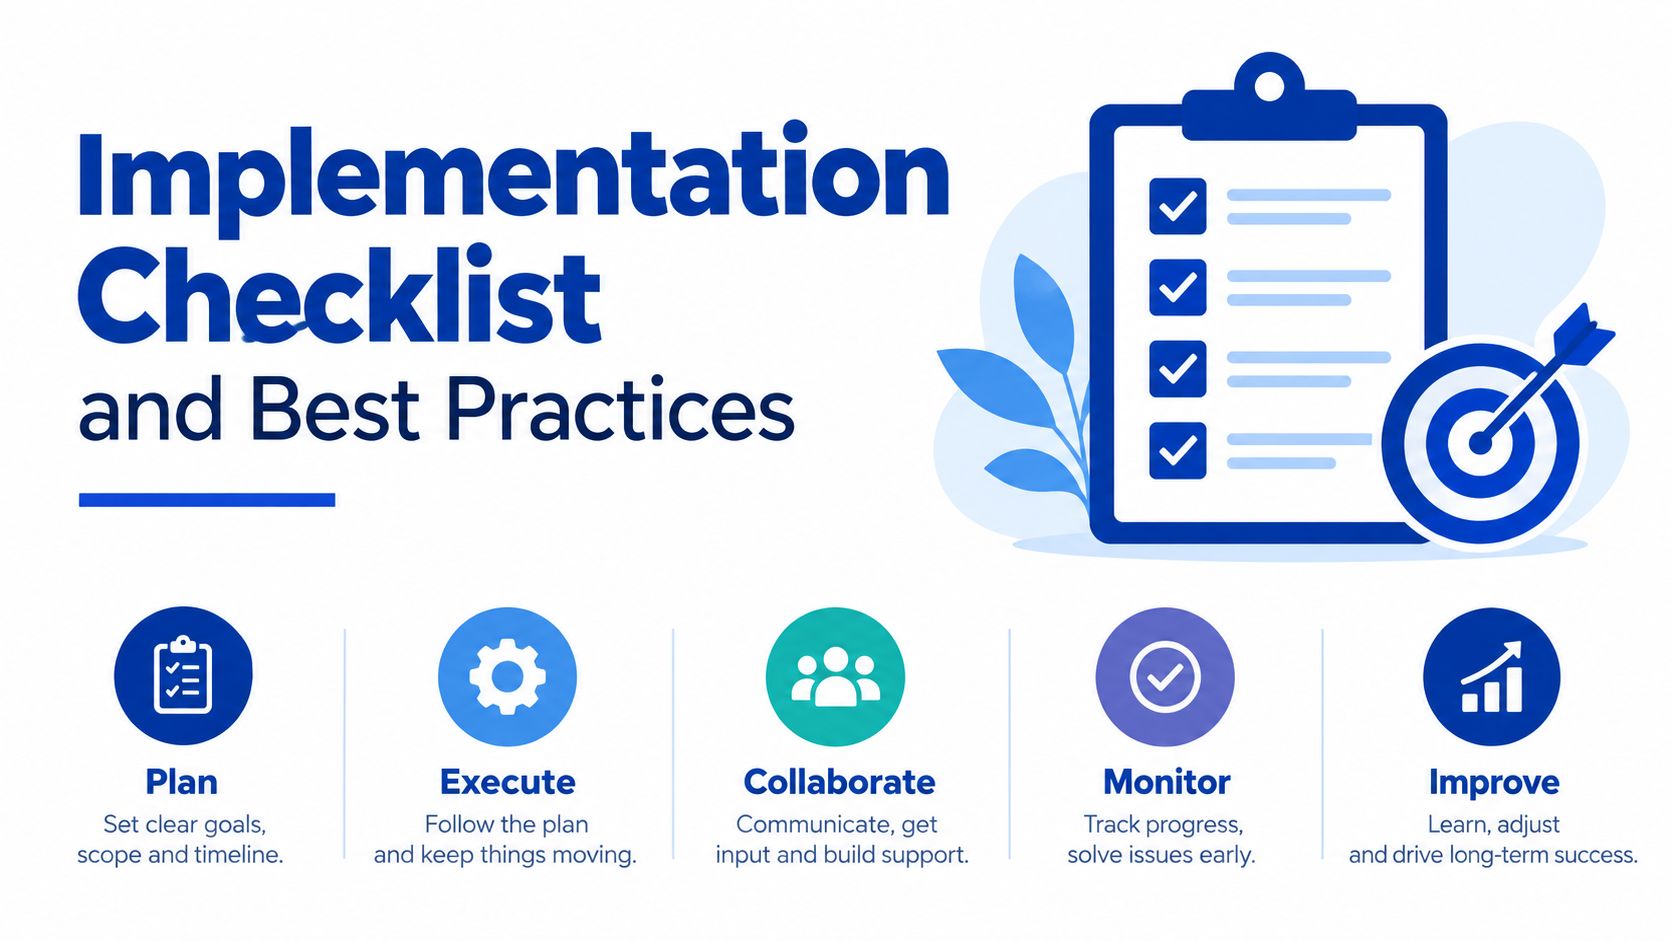
A useful APM rollout starts with a service decision, not a vendor demonstration. I use five phases and keep the first version intentionally narrow.
Establish a baseline
Capture normal production behaviour for two weeks before tuning alerts. Record the major user journeys, response distributions, business failures, deployment markers and dependency calls. Don't define “normal” from a quiet test environment. Real Australian users, devices and network routes expose conditions that staging won't reproduce.
Instrument the critical path
Choose language agents where they provide safe coverage, then use OpenTelemetry for portability and manual spans around business transactions. Tag the payment or membership journey first, along with authentication, database calls, queues and external APIs. Avoid instrumenting every service at once. Excess telemetry creates cost and query noise before the team has learned how to use it.
Build journey dashboards
Organise dashboards around customer outcomes rather than hostnames. A checkout dashboard should show journey latency, successful payments, business failures, dependency health and representative traces. A service dashboard can support engineering detail, but the primary view must tell the service owner whether customers can complete the work they came to do.
Alert on customer impact
Alert on Apdex degradation, error-budget burn, critical journey failure and dependency symptoms. CPU can be useful diagnostic context, but it isn't a reliable paging condition by itself. A host can be quiet while a carrier route or identity provider prevents every customer from completing a transaction.
Review and prune
Rotate on-call ownership and review incidents weekly with a consistent Post-Incident-Notes template. Record the customer impact, detection path, contributing dependencies, recovery action and monitoring gap. Remove dashboards nobody opens, review sampling during load tests, and control noisy agent versions before telemetry storage becomes an unmanaged bill.
A phased cloud migration service should carry the same instrumentation forward. Moving workloads without preserving trace context, ownership and service-level evidence creates a new blind spot at the exact moment the architecture changes.
Cost ROI and What to Do Next
APM pricing is rarely just a licence decision. Per-host models are easy to forecast but can become inefficient in elastic estates. Consumption-based models align spend with telemetry volume, but logs and high-cardinality attributes can grow faster than the engineering team expects. In practice, data ingest, retention and query volume often matter more than the headline platform fee.
The return comes from avoided uncertainty. In the opening incident, the team needs to distinguish an application regression from an external identity or carrier problem before support volume and abandoned payments increase. Faster diagnosis, fewer repeat incidents, fewer avoidable support contacts and audit-ready evidence all contribute to the business case.
Australian organisations also face a significant reliability downside. The New Relic research cited earlier reported outage costs above AUD 11 million per year at the median for Australian organisations, so the right comparison is not “monitoring versus no monitoring”. It is the cost of useful monitoring versus the cost of operating without evidence when a critical service degrades.
| Profile | Typical APM Spend (AUD/year) | Primary ROI Lever | First Service to Instrument |
|---|---|---|---|
| Enterprise | Depends on platform, ingest and retention scope | Faster incident response and governance evidence | Highest-value customer or citizen journey |
| NGO | OpenTelemetry backend and operational capacity determine cost | Reliable service delivery with controlled telemetry spend | Public website, member service or case-management workflow |
| Startup | Start with a focused error and uptime footprint | Preventing paid-user failures without overbuilding | First revenue-generating payment or onboarding flow |
My recommendation is straightforward. An enterprise should pilot across two business units and agree on shared service-level evidence. An NGO should standardise instrumentation with OpenTelemetry and keep retention deliberate. A startup can defer broad APM until paid traffic arrives, but it should instrument the first revenue-critical journey before that point.
Start with the payment flow, trace every important dependency, add real-user and synthetic evidence, then expand to the rest of the estate only where the data changes a decision.
Continuum Solutions helps organisations design AWS and Azure architectures, modernise applications, integrate business systems, and implement application monitoring with tools such as Sentry and New Relic. Visit Continuum Solutions to discuss an APM baseline, cloud migration or reliability review for your critical digital service.