
Your homepage is loading, your uptime check is green, and your customers still can’t renew, log in, or pay. I’ve seen this pattern repeatedly in Australian membership, ecommerce, and CRM-connected systems. The failure isn’t infrastructure. It’s buried in application events nobody centralised, nobody alerts on, and nobody can reconstruct after the fact.
Table of Contents
- Why Application Log Monitoring Fails Quietly
- How Application Logs Fit Observability
- What a Useful Application Log Must Capture
- Retention Cost and Privacy Trade-Offs
- From Stored Logs to Real Detection
- Choosing a Monitoring Approach for Your Stack
- A Practical Next Step for Your Team
Why Application Log Monitoring Fails Quietly
A member tries to renew at 9.40am. The website accepts the click, the payment step times out, and the CRM record never updates. Support hears about it from the member, not from your monitoring. Your engineer then finds one error file on the web server, different messages in the API, and nothing useful from the Salesforce connector.
That scatter is the true cost. You can’t tell which request failed, whether a bad release caused it, whether an identity permission changed overnight, or whether someone is probing a public-facing application. Application log monitoring means capturing time-stamped application events, bringing important ones into one searchable place, and using them to detect, triage, and explain production problems.
Green Uptime Does Not Mean Working Software
An external check confirms a page responds. It doesn’t confirm checkout, login, password reset, or a background sync works. If you want the boundary explained clearly, the IT Cloud Global uptime monitoring guide is useful background on what uptime checks cover, and by implication what they miss inside the application.
I treat uptime as the doorbell. Logs tell you who entered, what they tried, and where they got stuck. Teams that skip that layer often discover too late that a prototype has become production software without production controls, a trap I explore in why a vibe-coded app is not production-ready.
The Australian Incident Load Is Not Abstract
In 2023-24, the ASD responded to more than 1,100 cyber security incidents and received over 36,700 hotline calls, a 12% increase on the previous year, according to the ASD annual cyber threat report for 2023-2024. That same source puts exploitation of public-facing applications at 21% of activity types for critical infrastructure incidents.
Your logs are where authentication failures, privilege changes, suspicious requests, and exploitation attempts first become visible. Leave them in proprietary files on each host and you’ve built an evidence problem as well as a reliability problem.
If customers report incidents before your logs do, you don’t have monitoring. You have storage.
How Application Logs Fit Observability
Follow one membership renewal. A browser calls your web tier, the web tier calls an API, the API writes to a database, and a connector updates the CRM. A CPU graph can look normal while every renewal fails at the CRM step because a token expired.
You need three signals because each answers a different question. Metrics show something is unhealthy. Traces show the path one request took. Logs explain what the code, user, or integration did at each step.
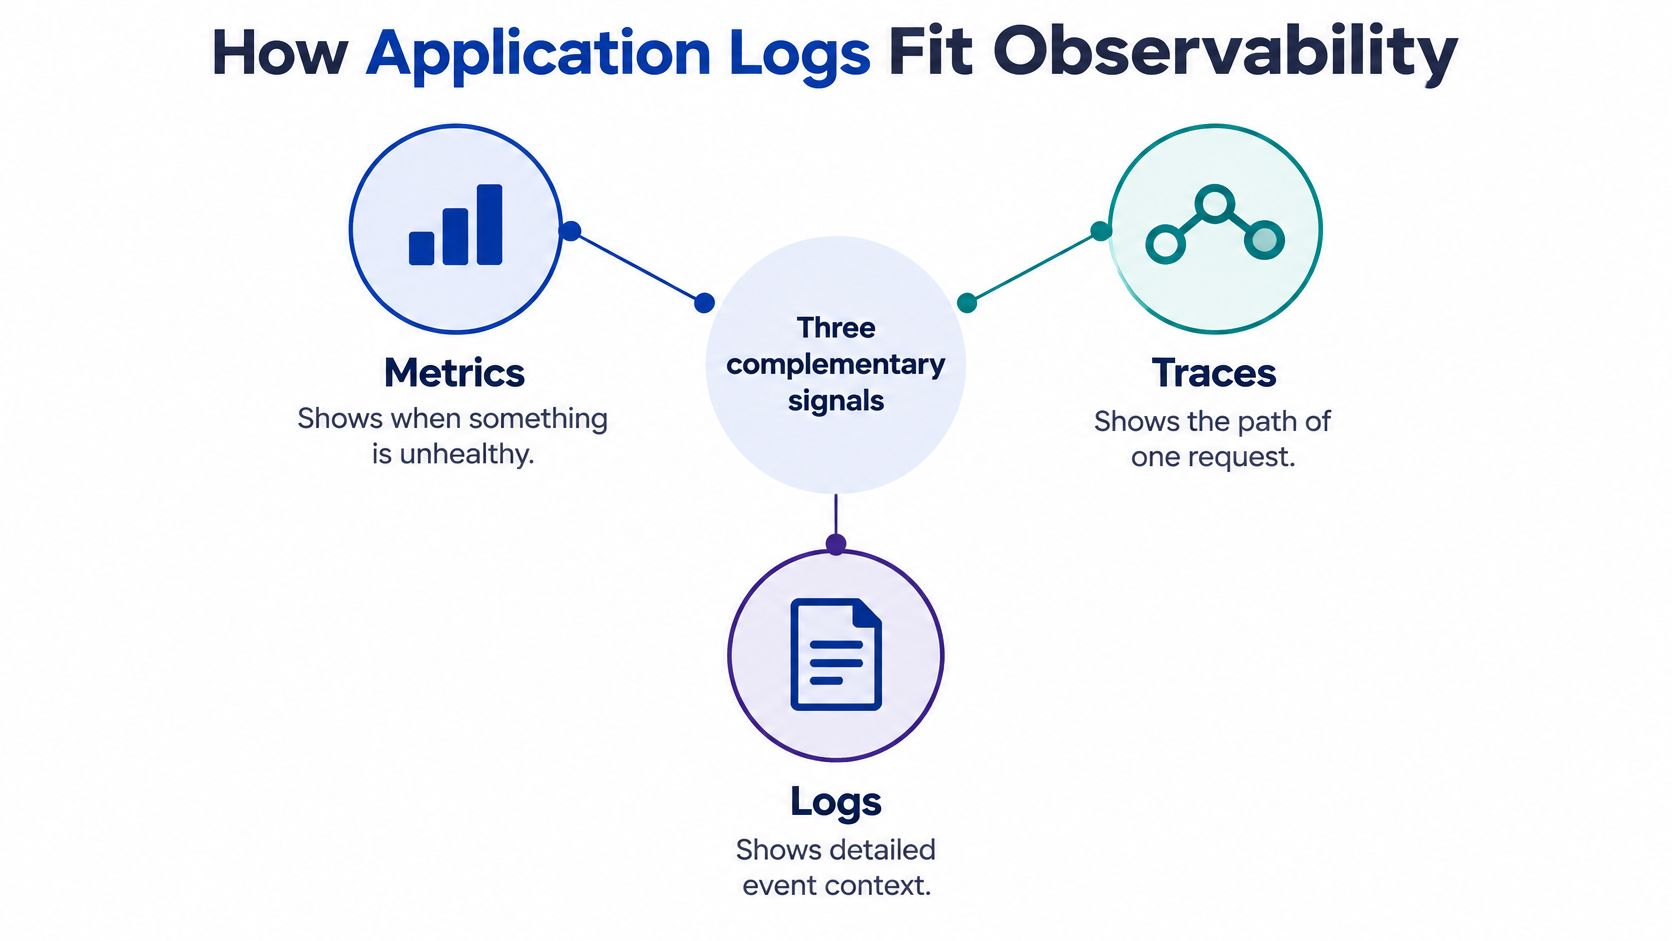
Where Each Signal Earns Its Keep
- Metrics first: Error rate, latency, queue depth, and saturation tell on-call staff where to look, within seconds.
- Traces second: A trace shows the renewal spent most of its time waiting on the CRM connector, not your database.
- Logs last and deepest: The connector log records the rejected credential, the affected member action, and the exact failure outcome.
For a broader framing of how these signals combine in modern apps, Capgo’s guide to app observability is a solid companion read. My advice is simpler. Don’t buy log volume to compensate for missing metrics, and don’t expect metrics to explain individual customer actions.
Central Search Changes the Operating Model
Logs left inside containers, serverless functions, or Windows hosts disappear on redeploy and can’t be correlated. Australian guidance has moved firms away from treating logs as developer troubleshooting files and towards governed security and reliability data, a shift reflected in the ACSC Essential Eight assessment process guide.pdf), which expects centralised logging at defined maturity levels.
The advantages are faster diagnosis and credible post-incident review. The disadvantages are real too. Ingestion costs money, noisy messages bury signal, and logging full payloads creates privacy exposure. That’s why observability design belongs inside your architecture decisions, not after go-live, as I set out in our cloud computing consulting approach.
Start with the customer journeys that lose revenue or trust when they fail. Instrument those paths first, then expand.
What a Useful Application Log Must Capture
I solved a recurring integration dispute once by adding one field, a correlation ID, to every service in the chain. Arguments about whose system dropped the transaction ended the same week. Field design, not tool choice, made the difference.
A minimum useful event captures when it happened, who or what acted, what was attempted, whether it succeeded, which system was affected, and the request identifier that ties the whole transaction together.
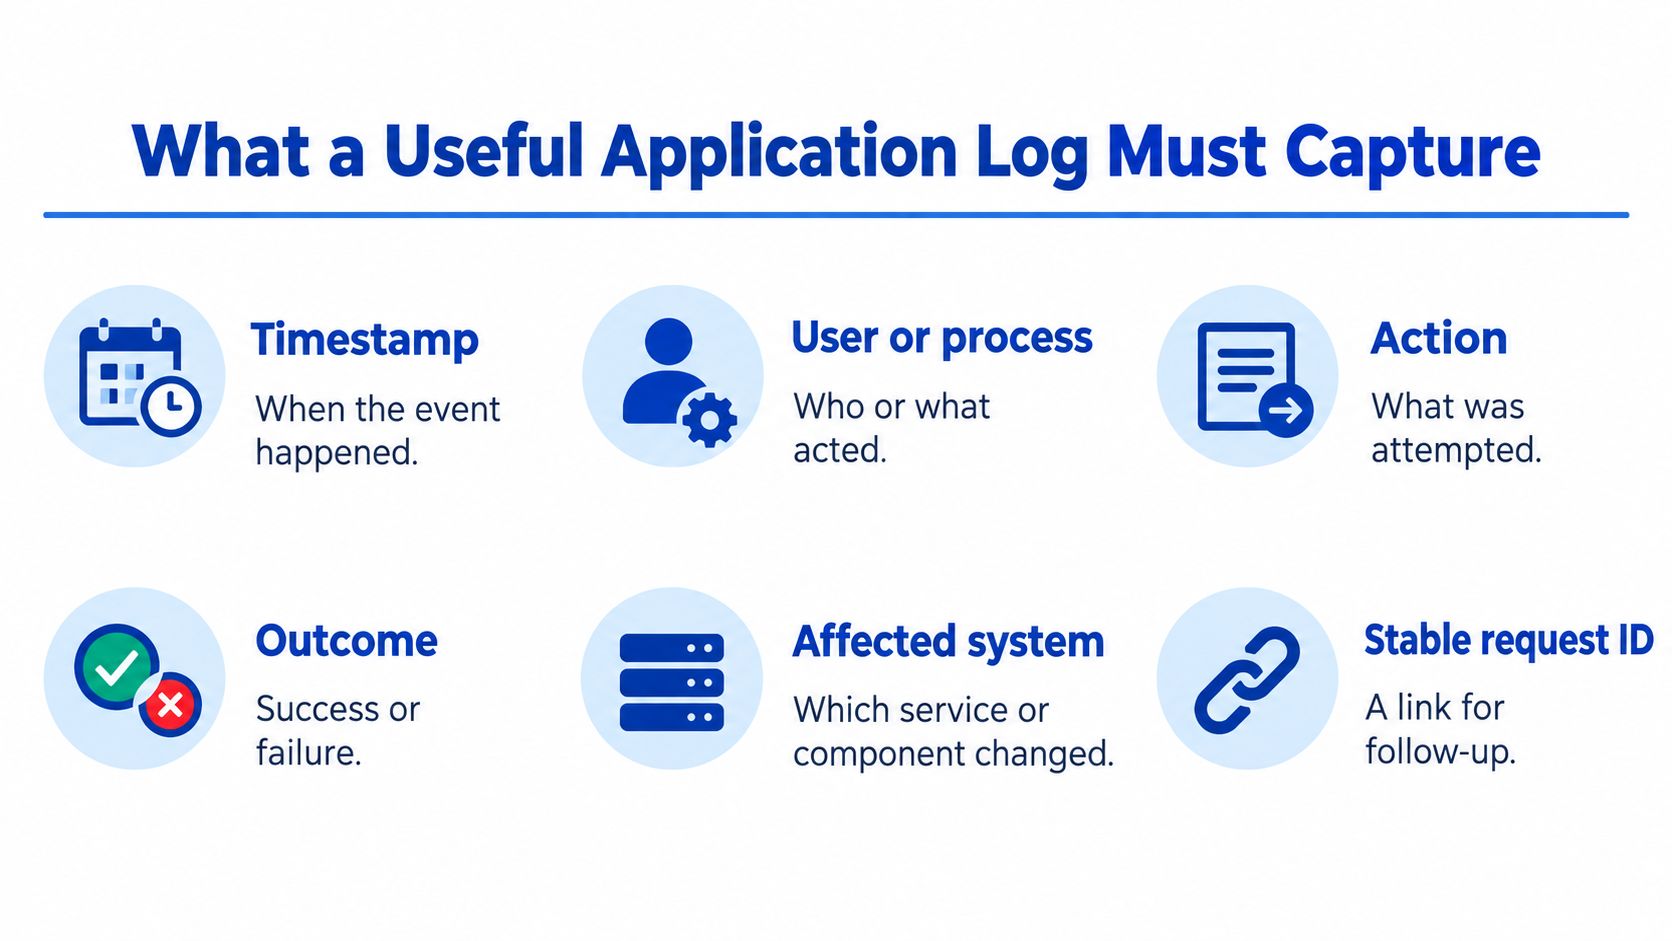
The Minimum Event Standard
Australian ISM guidance expects a centralised facility using a consistent structured format, with each event capturing its timestamp, responsible user or process, relevant filename, event description, and affected ICT equipment, as detailed in the ISM guidelines for system monitoring.pdf). I implement that as structured JSON, never free-text strings, so one query works across AWS, Azure, identity, and database layers.
Synchronise clocks everywhere. If your API gateway, Lambda function, and database disagree on time, you’ll reconstruct events in the wrong order and chase the wrong cause.
Events Worth Paying to Keep
- Identity events: Successful and failed logons, account lockouts, privilege changes, and administrative actions.
- Change events: Configuration and security policy changes, deployment errors, and service restarts.
- Application failures: Crashes, repeated exceptions, error messages, and failed background jobs.
- Abuse signals: Unusual API rates, mass data exports, and repeated authorisation failures.
Practical rule: Log the action and outcome, never the secret. Tokens, passwords, and full personal records don’t belong in a log line.
That last point is essential. I’ve audited systems logging entire request payloads, including credentials, because a developer needed temporary debugging. Redact at source. It’s cheaper and safer than scrubbing stored data later.
Build a short event catalogue for one internet-facing service and one internal integration. If you can’t name the events that matter on one page, you’re not ready to buy more tooling.
Retention Cost and Privacy Trade-Offs
One expiry period for every log is the most common retention mistake I see. It overpays for diagnostic noise and under-retains the security events you’ll need during an investigation. Separate the classes first, then set periods.
Australian guidance sets a clear floor. The ISM requires event logs retained in searchable form for at least 12 months, as stated in the ISM guidelines for security assurance. A compressed archive nobody can query doesn’t meet that operational purpose.
Application Log Classes and Retention Jobs
| Log class | Primary job | Searchable need | Privacy handling |
|---|---|---|---|
| Diagnostic and debug | Same-week troubleshooting | Short hot window | Strip identifiers aggressively |
| Authentication and authorisation | Intrusion confirmation | Long, fast search | Restrict analyst access |
| Administrative and config | Change accountability | Long, fast search | Protect from modification |
| Transaction and integration | Customer dispute resolution | Medium to long | Redact tokens and payload data |
Hot searchable storage serves alerting, triage, and performance work. Lower-cost archive serves historical hunting and audit evidence. The trade-off is query speed against storage cost, and it’s one of the quieter drivers behind the waste I describe in common AWS mistakes SMEs make.
Windows and Breach Timelines Raise the Bar
For Windows environments, ACSC guidance recommends at least 18 months of event log retention, according to its Windows event logging and forwarding guidance.pdf). If your application depends on Active Directory or IIS, plan for that longer window when correlating identity and application events.
Retention also collides with privacy law timelines. Under the Notifiable Data Breaches scheme, assessment should generally complete within 30 days, and the OAIC reported 74% of entities notified within 30 days in its notifiable data breaches report for January to June 2023. You can’t meet that pace if account, record, and time window data expired last month.
For NGOs, ecommerce, and CRM platforms, logs may hold identifiers, health-related details, or transaction data. Apply redaction, tight access control, and integrity protection so stored logs can’t be altered without detection. Keep what proves what happened. Delete what only creates exposure.
From Stored Logs to Real Detection
Centralised collection is not detection, and Australian government data proves the gap. The Commonwealth posture report found 90% of Commonwealth entities had centralised logging in 2025, yet only 35% reported at least half of observed incidents to the ASD, as documented in the Commonwealth cyber security posture in 2025.
The pipes existed. Acting on the signals did not. I see the same pattern in commercial environments: a platform purchase gets announced as a monitoring outcome, and leadership assumes the risk is handled. It is not. Stored logs only reduce exposure when someone can search them, alert on them, and act before an incident report forces the issue.
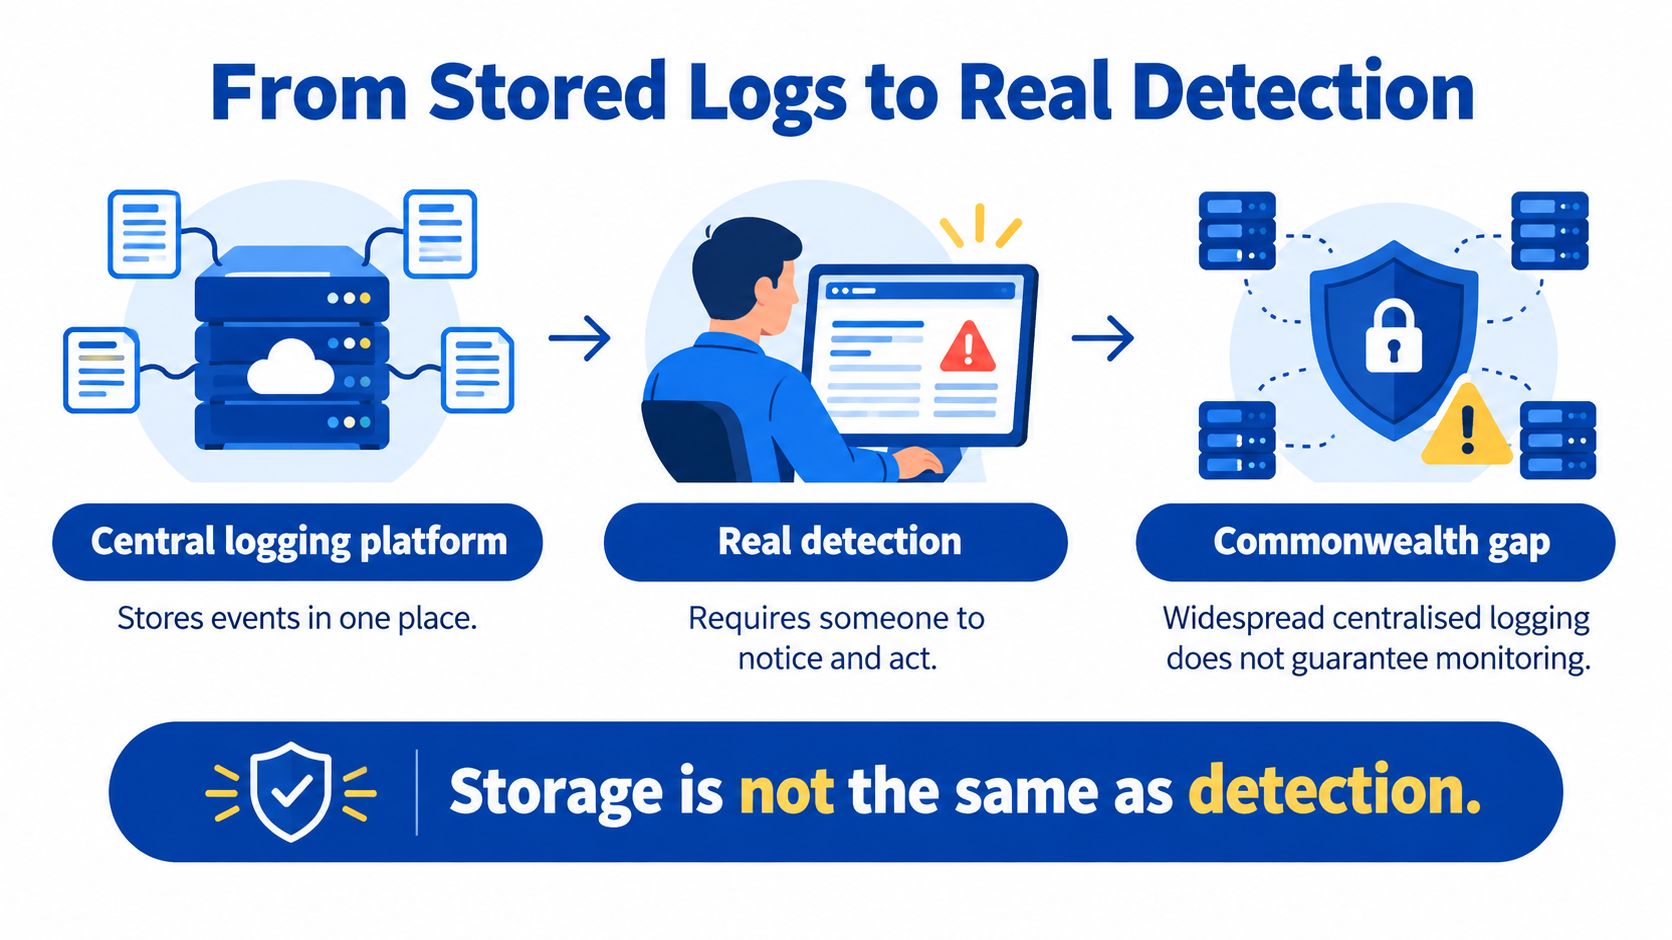
A Small Set of Baselines Beats Total Ingestion
Detection is a risk decision. Every alert you define is a bet on which failure or intrusion pattern would cost you most to miss, and every undefined pattern is a cost you have chosen to carry. Define normal for your application, then alert on meaningful deviation:
- Authentication anomalies: Failure bursts against one account or from one source.
- Privilege changes: Any elevation outside a change window pages a human.
- API error bursts: Sudden spikes after a release trigger rollback review.
- Business anomalies: Payment, donation, or export volumes that break pattern.
Every alert needs an owner, a severity, a runbook, and a time-to-detection target. Without all four, the alert is noise that consumes investigation budget instead of cutting it. That operating discipline is what separates enterprise application monitoring and debugging from a dashboard nobody checks.
Mistakes That Kill Analyst Confidence
Three errors account for most failed detection programs I review. Alerting on every exception trains staff to ignore alerts. Ignoring internal APIs and queues because the website looks healthy misses where failures propagate. Leaving logs modifiable by the administrators under investigation destroys their evidentiary value.
Test your setup with one question. Would today’s logs and alerts have caught your last customer-impacting incident before customers did? If not, you have a detection gap, and no ingestion volume will close it.
Choosing a Monitoring Approach for Your Stack
Don’t start with vendor demos. Start with staffing. The right approach is the one your team will operate at 2am, and the wrong one is a powerful platform nobody queries.
If you’re weighing how much platform to adopt versus how much to instrument yourself, the discussion of observability and monitoring trade-offs is worth reading before you shortlist tools.

Three Approaches and Who They Suit
Native cloud logging, such as CloudWatch or Azure Monitor, suits startups and smaller teams already committed to one cloud. It’s close to the platform, cheap to start, and covers infrastructure plus application events. The downside is query experience and cross-system correlation as you add SaaS connectors. Your hosting choice shapes this, which is why I compare operational overhead in AWS Lightsail vs EC2 vs ECS.
Application-level error monitoring, using tools such as Sentry and New Relic, suits product teams shipping frequently. You get exception grouping, release regression tracking, and performance context developers use. It won’t replace security monitoring, and per-event pricing rewards disciplined logging.
SIEM or SOAR platforms suit enterprises whose security operations must correlate real-time and historical telemetry across identity, network, and applications. They’re powerful and expensive to run well. Buying one without analysts to tune detections is the costliest mistake in this category.
How I Implement It During Migrations
Continuum Solutions, a Melbourne cloud and integration consultancy, implements this during AWS and Azure migrations by standardising structured events across serverless functions, containers, REST APIs, and CRM connectors such as Salesforce or HubSpot, then layering Sentry and New Relic with uptime checks and on-call support. That’s one implementation path among several, and it works because the event standard comes before the dashboards.
Buy the smallest platform that covers your owned alerts. Expand retention and tooling only when a real investigation demands it.
A Practical Next Step for Your Team
Pick one production application this month. Not the whole estate. One system where failure costs money, donations, or trust, and run this sequence on it.
The One-Month Sequence
- Name the journeys: List the customer actions that must work, such as login, renewal, checkout, or donation.
- Define proof events: For each journey, list the events that prove it failed or was misused.
- Verify correlation: Confirm one request ID crosses web, API, identity, and data layers end to end.
- Clean the lines: Remove secrets and unnecessary personal data from new log output.
- Assign ownership: Give every resulting alert a named owner and an escalation path.
Then run a short cost check. What are you ingesting today, what has nobody queried in months, and what would be missing during a 30-day breach assessment? ACSC guidance expects an enterprise-approved logging policy with retention based on system risk, prioritising logs that confirm intrusions, as set out in its best practices for event logging and threat detection. Your cost check is how that policy becomes real numbers.
Set the searchable retention period for high-value events deliberately, using the 12-month Australian floor discussed earlier as your starting point rather than a vendor default. Shorter windows may suit debug noise. They don’t suit authentication or administrative records.
If you’re planning a migration or integration, do this review before cutover, not after. Retrofitting logging standards across a live AWS or Azure estate, plus connected CRM and ecommerce systems, costs more and disrupts more. Get the event catalogue, retention tiers, and alert ownership documented, then hand operations to your internal team with runbooks they’ll follow.
You’ll end the month with fewer logs, better logs, and alerts that mean something. That’s the outcome worth paying for.
If your team is planning an AWS or Azure migration, modernising a legacy application, or integrating CRM and ecommerce systems, we can scope a focused logging and observability review before cutover and implement the monitoring path with documented handover. Visit Continuum Solutions to start a conversation about making your production systems observable, supportable, and ready to scale.