A release has gone live, checkout transactions are slowing, and the operations team can see errors in several places but can't explain how they connect. One engineer prefers native AWS or Azure monitoring, another wants an all-in-one observability suite, and the development team is asking for a focused application performance monitoring tool that can trace code and surface regressions quickly.
The right decision isn't the platform with the longest feature list. It depends on your architecture, team capability, data volume, existing logging, cloud strategy, compliance requirements and budget. A serverless AWS startup, a Microsoft-heavy enterprise, an NGO with strict cost controls and an ecommerce business protecting checkout reliability shouldn't make the same choice.
This comparison examines application performance monitoring tools against practical procurement and delivery decisions. Each option is assessed for capabilities, limitations, pricing considerations, integrations, best-fit organisations and implementation effort. The emphasis is on what happens after installation, when teams need to investigate a slow transaction, control telemetry costs or operate across a migration.
Table of Contents
- 1. Datadog APM
- 2. New Relic
- 3. Dynatrace
- 4. Cisco AppDynamics
- 5. Splunk Observability Cloud
- 6. Elastic APM
- 7. Grafana Cloud Application Observability
- 8. Sentry Performance Monitoring
- 9. Azure Monitor Application Insights
- 10. AWS X-Ray
- Top 10 APM Tools, Feature Comparison
- Turn the Shortlist Into an Operational Monitoring Plan
1. Datadog APM
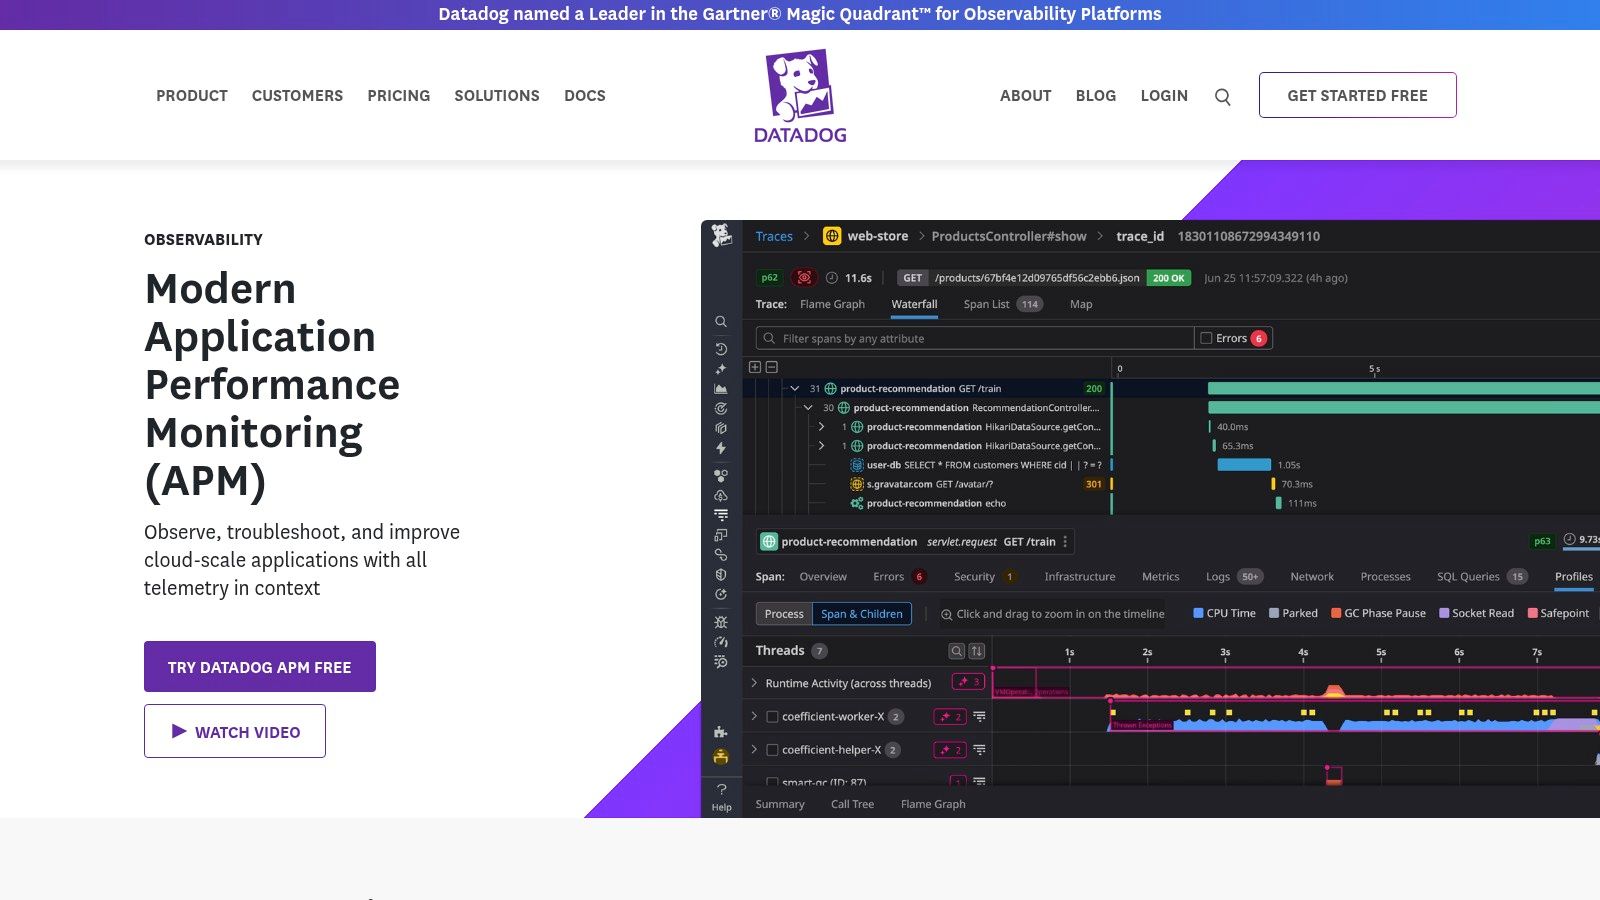
Datadog APM is a strong choice when application performance is only one part of a wider monitoring problem. It correlates code-level distributed traces with logs, infrastructure metrics, real user monitoring and security signals, which is useful when a microservice incident crosses Kubernetes, a managed database and a third-party API.
Its service maps and thread-level tracing help engineers move from a slow request to the code path consuming time. Change Tracking can relate deployments, feature flags and configuration changes to regressions, while Watchdog provides anomaly detection and root-cause suggestions. Datadog also supports native and hybrid OpenTelemetry ingestion, giving migration teams a way to standardise instrumentation without making every signal dependent on one proprietary agent.
Practical rule: Datadog reduces tool sprawl only when the organisation governs which telemetry it collects, retains and indexes.
The trade-off is commercial complexity. Usage-based pricing can become difficult to forecast as hosts, containers, logs, custom metrics, traces and optional products expand. Procurement should model production growth, sampling and retention before approving a broad rollout.
Datadog suits enterprise teams running AWS and Azure together, Kubernetes platforms, serverless workloads and distributed applications. It may be excessive for a small team that only needs error tracking and basic request traces. For organisations needing a structured approach to enterprise application monitoring and debugging, the main implementation task is designing ownership, dashboards and cost controls before onboarding every service. Review the platform's current capabilities on the Datadog APM product page.
2. New Relic
New Relic works well for application teams that want a unified platform without assembling separate products for application traces, logs, infrastructure, browser monitoring, mobile monitoring, synthetics and profiling. Its Transaction 360 views connect the request path with errors, dependencies and related telemetry, which is particularly useful in estates combining a traditional monolith with newer microservices.
The platform supports distributed tracing, error tracking and a broad integration ecosystem. New Relic describes the platform as supporting 780+ integrations and unlimited hosts, with pricing shaped by data usage and user roles, as outlined in its pricing information. That model can make initial adoption straightforward, but full-platform access for Pro or Enterprise users and optional add-ons can change the economics as more teams join.
For a mixed Java, .NET, Node, Go or Python environment, curated views reduce the amount of dashboard construction developers need to do. The platform is also a practical fit when a business wants one investigation path from browser behaviour to an API transaction and then into infrastructure.
The limitation is data governance. Teams still need to control ingest volume, retention and the audiences receiving access to detailed telemetry. Australian buyers should also test where data is stored and how access controls support their privacy and incident-response requirements. New Relic is a sensible shortlist option for product teams that value quick adoption, but it needs a clear data budget rather than an unrestricted rollout.
3. Dynatrace
Dynatrace is aimed at organisations where the main monitoring challenge is complexity, not just missing traces. OneAgent automatically discovers and instruments a wide range of application and infrastructure components, while Smartscape maps relationships between services, processes and hosts. That can reduce manual wiring across a large estate containing legacy applications, containers and cloud services.
Davis provides AI-assisted problem detection and causal analysis. Used properly, it can help an operations team group related symptoms into a broader problem instead of raising separate alerts for every affected dependency. The value is highest when service ownership, deployment metadata and topology information are accurate. Automation doesn't replace operating discipline, and a badly modelled environment can still produce confusing results.
The platform has broad OpenTelemetry support, which matters during modernisation programs where teams want a more portable instrumentation layer. However, OneAgent remains central to the easiest full-stack experience, so architects should document what telemetry can be exported and how much vendor-specific configuration the environment will retain.
The premium price makes more sense when reducing investigation effort across a complex estate matters more than minimising licence spend.
Dynatrace is a strong enterprise candidate for hybrid environments, large Kubernetes estates and migrations involving many dependencies. Its disadvantages are premium pricing and a learning curve around Davis, Smartscape and advanced configuration. A smaller startup with a handful of services may find the platform harder to justify and operate than a focused APM product. Evaluate it with a representative incident, not a polished demonstration, using the Dynatrace platform as the starting point.
4. Cisco AppDynamics
Cisco AppDynamics remains relevant where application owners think in business transactions rather than isolated technical components. It maps application and database performance to activities such as authentication, order submission or payment processing. That transaction-centric view can help an enterprise explain operational impact to business stakeholders without translating every incident from host metrics and service traces.
The platform is particularly suited to Java and .NET estates, SAP environments and hybrid deployments that still include on-premises systems. Backend diagnostics, database visibility and end-user monitoring provide a useful chain from a customer-facing transaction to a slow query or dependent service. SaaS and self-managed controller deployment options also give enterprises more flexibility during a staged cloud transition.
Its licensing approach can be easier to plan when infrastructure-based CPU-core models align with the organisation's procurement process. That doesn't mean the total cost is automatically predictable. Buyers should confirm what functionality is included, which add-ons are required and how monitoring scope changes across production, disaster recovery and development environments.
The main disadvantage is that AppDynamics feels less convenient for some newer serverless and edge patterns than platforms designed around cloud-native workloads from the outset. Teams should test Lambda, containers, managed services and modern frontend journeys rather than assume that a strong traditional application fit will transfer unchanged.
AppDynamics is a credible option for a large enterprise replacing fragmented transaction monitoring while retaining hybrid infrastructure. It isn't the first tool I'd choose for a small product team building a serverless mobile backend. Review the current Cisco AppDynamics offering alongside a licensing workshop and a business-critical transaction test.
5. Splunk Observability Cloud
Splunk Observability Cloud is most compelling when Splunk already forms the organisation's logging and security backbone. Splunk APM connects full-fidelity traces with logs and metrics, while AlwaysOn profiling can help identify code-level resource consumption without waiting for a performance problem to be reproduced manually.
Its OpenTelemetry-native approach suits teams dealing with high-cardinality data, request identifiers and detailed distributed transactions. In an ecommerce environment, for example, engineers may need to separate a latency issue by service, endpoint, region, payment provider or release version. The ability to investigate across signals is more useful than a dashboard that only displays average response time.
AI and machine-learning assisted troubleshooting can guide investigations, but the implementation still depends on consistent naming, useful attributes and sensible retention. Capturing everything without a governance model can make the bill and the search experience difficult to manage.
Procurement test: Compare the cost and workflow of adding APM to an existing Splunk operating model against introducing a separate observability platform.
Splunk's licensing model can be complex, and the strongest value usually appears when security, logs, metrics and traces are managed as one toolchain. A startup buying only APM may be paying for capability it won't use. A large regulated organisation with established Splunk skills may value shared access controls, investigation workflows and existing operational knowledge. Teams planning cloud computing consulting should include data architecture, retention and ownership in the evaluation, not just agent installation. See the Splunk Observability Cloud product for the current platform scope.
6. Elastic APM
Elastic APM suits teams that already rely on Elastic for logs, search and analytics. Traces, logs and metrics can be explored through a familiar search-oriented workflow, while service maps, real user monitoring and distributed tracing provide the application view missing from a log-only deployment.
The deployment choice is important. Elastic Cloud reduces the operational burden, while a self-managed deployment gives the organisation more direct control over infrastructure, data location and retention. OpenTelemetry Collector compatibility also supports a more portable instrumentation approach. Tail-based sampling can retain interesting traces after their full context is known, although it requires careful storage and processing design.
Elastic's flexibility comes with assembly work. The team needs to design data streams, index or data tier policies, dashboards, access controls and alerting conventions. Engineers who understand Elasticsearch can move quickly, but a business without that expertise may underestimate the effort required to keep the platform healthy and queries useful.
For an NGO or cost-sensitive business with existing Elastic skills, controlling retention and storage tiers can be attractive. For a small team with no search or platform engineering capability, a managed turnkey APM product may have lower operational risk even if its licence appears higher.
Elastic is a good choice when search is a core investigation method and the organisation wants cloud or self-managed deployment options. Start with one service and one incident workflow, then confirm that the team can trace a request from frontend to database without building excessive custom tooling. The Elastic APM product provides the relevant deployment and feature context.
7. Grafana Cloud Application Observability
Grafana Cloud Application Observability is a sensible candidate for teams committed to open tooling and vendor-neutral telemetry. It sits on Grafana's LGTM approach, combining Loki, Grafana, Tempo and Mimir with OpenTelemetry-first ingestion. Prometheus and PromQL remain familiar to infrastructure teams, while Tempo and TraceQL support distributed trace analysis.
The Knowledge Graph discovers services and relates signals, with RED metrics and intelligent insights helping application teams build a starting view without designing every dashboard from scratch. Metrics generated from traces can also simplify instrumentation for teams that need service-level request, error and duration measures quickly.
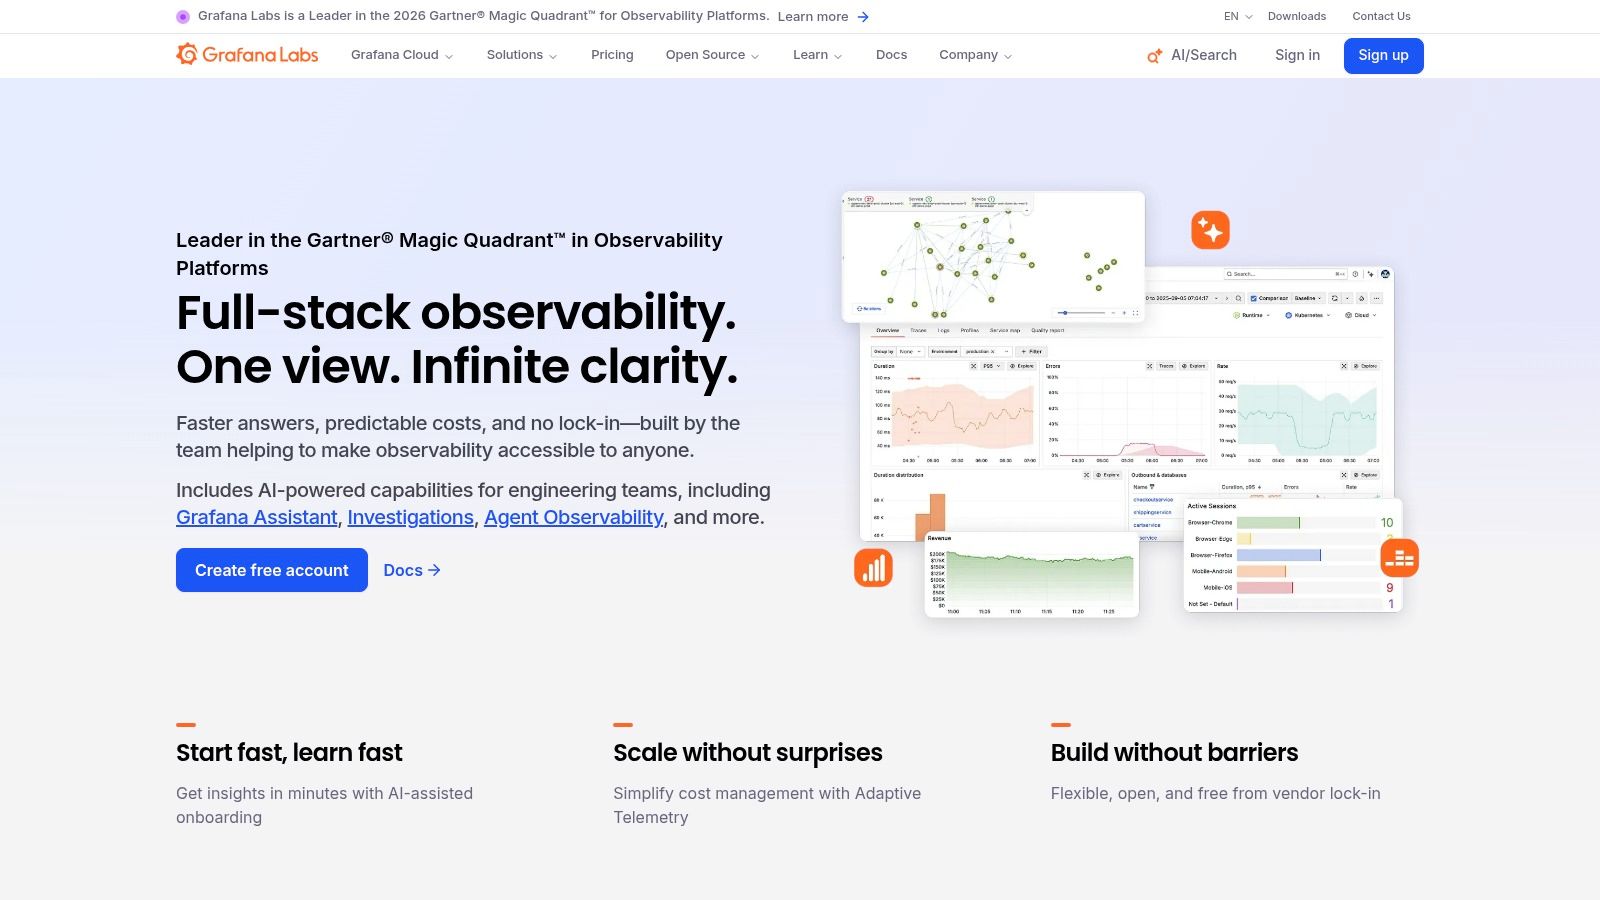
The open posture is the main advantage. OpenTelemetry and widely used query languages can reduce the cost of changing backends later. The compromise is that the best results require a coherent LGTM operating model. Teams that only install Grafana Cloud without agreeing on labels, service names, trace attributes and ownership will get attractive dashboards without dependable incident context.
Pricing documentation and a free tier can help startups and NGOs begin with limited scope, but free usage doesn't remove the need to estimate retention and ingest at production scale. A team with limited operational capacity should compare managed Grafana Cloud with self-hosted components before assuming that open tooling is cheaper.
Grafana Cloud fits organisations that want a managed path while preserving an open instrumentation strategy. It's also useful for AWS or Azure teams that already use Prometheus and need application traces added without abandoning their existing model. Use the Grafana Cloud platform to validate the current product boundaries and cost controls.
8. Sentry Performance Monitoring
Sentry Performance Monitoring takes a developer-first route. Its strongest workflow is moving from an application error to the affected performance span, slow transaction or N+1 query without asking an engineer to correlate several systems manually. That makes it particularly effective for product teams supporting web applications, progressive web apps and mobile products.
Distributed tracing links performance spans with issues, while high-cardinality trace-connected metrics support detailed queries and alerting. The SDK coverage for web and mobile applications is useful when a business needs to understand whether a problem affects a browser journey, a Flutter application, a React Native build or the backend service handling the request.
Sentry isn't a complete infrastructure observability suite. Teams commonly need a complementary solution for hosts, networks, Kubernetes capacity, cloud services and security information. That isn't a weakness if the development team needs fast defect triage, but it matters during procurement because Sentry may be one layer of the operating model rather than the only monitoring platform.
Data residency and enterprise governance options also deserve close review, particularly for applications handling personal or sensitive information. A self-hosted option may address some requirements, but it introduces operational responsibility.
Sentry is a good fit for a startup or mobile product team where error-to-trace speed matters more than broad infrastructure correlation. It can also complement a platform such as CloudWatch or Grafana. For teams building or stabilising a cross-platform product, MVP development services should include monitoring ownership and release diagnostics from the beginning. Visit the Sentry platform to assess the current performance and deployment options.
9. Azure Monitor Application Insights
Azure Monitor Application Insights is the natural starting point for many Azure migrations and Microsoft-heavy application estates. It provides automatic dependency tracking, distributed tracing, availability tests, Live Metrics and end-to-end transaction search, with deep links into Azure services and DevOps workflows.
The advantage is low operational friction. Azure RBAC, policy controls and native connections to services such as App Service, Functions, Azure Kubernetes Service and Azure DevOps can make the platform easier to govern than introducing a separate observability vendor. .NET teams also benefit from familiar platform integration and a direct route from deployment activity to application telemetry.
Cost control requires discipline. Application Insights data flows through Log Analytics, so ingest, retention, workspace design and query patterns can create unexpected charges when teams enable verbose diagnostics everywhere. Sampling and daily caps help, but caps must be aligned with incident needs. A cap that protects the budget by discarding the evidence required for a payment failure isn't a successful control.
Cross-cloud visibility is weaker than with vendor-neutral suites, especially where AWS, Azure and on-premises dependencies share one customer journey. Azure Monitor is therefore strongest when Azure is the centre of gravity, not when the organisation needs one equally deep view across several providers.
For teams moving legacy .NET workloads into Azure, start with critical dependencies and define workspace ownership before migration waves begin. Cloud migration services should treat monitoring baselines, sampling and rollback evidence as part of the cutover architecture. Review the current Azure Monitor service before selecting the final design.
10. AWS X-Ray
AWS X-Ray is an efficient default for AWS-heavy applications, particularly serverless and microservices architectures. It traces requests across supported components, captures exceptions and builds a service map that helps engineers understand how Lambda functions, APIs, queues and downstream services participate in a transaction.
The tight connection with CloudWatch is its practical strength. Teams can combine X-Ray traces with CloudWatch metrics, logs and alarms rather than adding a separate platform before the application has reached the complexity that justifies one. SDKs for major runtimes and integrations with AWS services also reduce the initial implementation work.
X-Ray is less compelling for multi-cloud environments or businesses that need a single investigation model across AWS, Azure, SaaS dependencies and on-premises systems. Its interface and cross-signal correlation are simpler than those of broad third-party suites. Engineers may also need to combine X-Ray with CloudWatch Synthetics, real user monitoring, infrastructure metrics and centralised logging to cover the complete user journey.
Implementation decision: Use X-Ray as a deliberate AWS baseline, then add OpenTelemetry or a broader platform when cross-environment correlation becomes an operational requirement.
For a small AWS startup, NGO or membership platform, this staged approach can protect cash flow and avoid operating an observability suite before it's needed. For an enterprise migrating several clouds, establish a common telemetry model early so a native AWS choice doesn't create a later integration boundary. Teams assessing AWS hosting for membership platforms should test login, subscription, renewal and notification flows rather than monitoring only Lambda duration. Check the current AWS X-Ray service for supported integrations and deployment details.
Top 10 APM Tools, Feature Comparison
| Product | Core features | Strengths / UX & reliability | Best fit / Target audience | Pricing / Cost notes |
|---|---|---|---|---|
| Datadog APM | Code‑level distributed tracing, service maps, logs/metrics/RUM/security correlation, OpenTelemetry | Fast onboarding, deep integrations, Watchdog AI, strong K8s/serverless support | Multi‑cloud migrations, microservices teams reducing tool sprawl | Usage‑based & complex; requires cost controls, extra SKUs for advanced features |
| New Relic | APM, logs, infra, RUM, synthetics, profiling; unified data model | Curated Transaction 360 views, 780+ integrations, simple platform entry | Mixed monolith + microservices estates, application teams | Ingest‑sensitive; user tiers raise costs at Pro/Enterprise levels |
| Dynatrace | OneAgent auto‑instrumentation, Davis AI causal analysis, OpenTelemetry | Precise, low‑noise detection at scale; strong auto‑discovery | Large enterprises with complex dependencies and scale | Premium pricing; steeper learning curve for advanced features |
| Cisco AppDynamics | Business transaction mapping, DB visibility, end‑user monitoring, SaaS/self‑managed | Transaction‑centric views, predictable CPU‑core licensing options | Enterprise Java/.NET/SAP landscapes, hybrid on‑prem + cloud | Enterprise sales model; licensing may need add‑ons, contact sales |
| Splunk Observability Cloud | OpenTelemetry‑native traces, AlwaysOn profiling, logs+metrics correlation | High‑cardinality handling, integrated profiling, AI/ML troubleshooting | Organisations already standardised on Splunk, high‑cardinality use cases | Complex licensing; best value when standardising on Splunk toolchain |
| Elastic APM | OpenTelemetry tracing, RUM, service maps, powerful search/analytics | Flexible deployment (Cloud or self‑host), strong search across signals | Teams using Elastic for logs who want analytics‑first observability | More assembly required; cost control via data tiers/retention policies |
| Grafana Cloud – Application Observability | LGTM stack (Loki/Tempo/Mimir), OpenTelemetry‑first, Knowledge Graph | Open tooling, vendor neutrality, transparent docs, free tier | Teams preferring OSS stack and avoiding vendor lock‑in | Generous free tier; usage‑based for higher volumes; some config needed |
| Sentry Performance Monitoring | Error tracking + distributed tracing, trace‑connected metrics, SDKs | Fast path from error→slow transaction, strong web/mobile SDKs (Flutter/React Native) | Product teams, PWAs and mobile apps needing developer‑centric tooling | Developer‑friendly plans; not a full infra observability suite, may need complements |
| Azure Monitor – Application Insights | Live Metrics, distributed tracing, availability tests, KQL analytics | Deep Azure integration, RBAC/policy alignment, low friction for Azure workloads | Azure migrations, .NET estates, hybrid Azure environments | Cost tied to Log Analytics ingest/retention; use caps to prevent surprise bills |
| AWS X‑Ray | Distributed request tracing, service maps, SDKs, CloudWatch integration | Minimal friction inside AWS, cost‑effective for serverless/containerised apps | AWS‑heavy stacks and serverless‑first teams | Cost‑effective inside AWS; less turnkey for multi‑cloud visibility |
Turn the Shortlist Into an Operational Monitoring Plan
The shortlist becomes useful when it maps to an operating model rather than a brand preference. A native AWS estate can begin with X-Ray and CloudWatch, while an Azure migration can use Application Insights and Log Analytics to keep telemetry close to the platform's identity, policy and deployment controls. That route usually reduces initial integration work, but it needs a plan for cross-cloud visibility if the architecture later expands.
Datadog, New Relic and Dynatrace are stronger candidates when the organisation runs Kubernetes, multiple clouds or a broad mixture of managed services. Datadog suits teams prioritising breadth and integrations, New Relic suits application teams wanting curated full-stack workflows, and Dynatrace suits enterprises that value automatic discovery across complex dependencies. Splunk and Elastic make more sense when logs and search already anchor the operating model.
Grafana Cloud is the practical path for teams that want OpenTelemetry, Prometheus and vendor flexibility. Sentry is better when the immediate problem is moving quickly from frontend or backend errors to the slow transaction that caused them. None of these decisions should be made from a feature checklist alone. The tool has to match the people who will instrument services, respond to alerts, manage retention and pay for the data.
Australian buyers also need to include privacy and breach response in the architecture. The Office of the Australian Information Commissioner recorded 1,205 data breach notifications in 2025, an 8% increase from 2024, as reported in its 2025 data breach notification update. Since 30 May 2025, organisations with annual turnover above AUD 3 million and critical-infrastructure entities must report ransomware payments within 72 hours, according to the same OAIC reference. Monitoring data should therefore be treated as both operational evidence and potentially sensitive information.
Australia's APM market generated USD 77.5 million in 2024 and is projected to reach USD 202.2 million by 2030, implying a 17.8% CAGR from 2025 to 2030, according to Grand View Research's Australia APM outlook. The same source identifies real user monitoring as the largest revenue-generating type and synthetic monitoring as the fastest-growing segment. That reinforces a practical point: backend traces alone won't explain every customer-impacting failure.
A 2023 regional survey found that 43% of Australian organisations had at least 10 of 17 key observability capabilities deployed, while 53% already used APM. It also found 54% used five or more observability tools, 49% had siloed telemetry and only 20% had invested in synthetic monitoring, as reported by TechRepublic's Australia observability coverage. Tool selection should therefore address consolidation and missing coverage, rather than just adding another dashboard.
Start the evaluation with a small, representative proof of concept:
- Map critical journeys: Trace login, search, checkout, payment, subscription renewal or another workflow that directly affects revenue, service delivery or member access.
- Document dependencies: Include databases, queues, identity providers, payment gateways, mobile clients, third-party APIs and deployment pipelines.
- Define service-level indicators: Agree on latency, error rate, availability, queue delay, successful transaction rate and trace coverage before choosing alert thresholds.
- Estimate telemetry economics: Model ingest, sampling, storage, retention, user access and optional products across production and non-production environments.
- Test an incident: Reproduce a deployment regression, checkout latency problem, API failure and serverless timeout. Measure how quickly engineers can move from symptom to evidence.
- Set ownership: Assign application, platform, security and commercial owners for instrumentation, dashboards, alerts, access reviews and monthly cost checks.
- Build playbooks: Record the investigation and escalation steps for each critical failure, including what evidence must be preserved and who can approve a rollback.
The best proof of concept uses real traffic patterns and real team members, not a vendor-provided sample application. Run the candidate tools alongside the existing system long enough to compare trace completeness, alert quality, query speed, data location and operational effort. OpenTelemetry can provide a useful portability layer, but it doesn't remove the need to standardise naming, attributes, sampling and ownership.
A cloud consultancy becomes valuable when the tool decision is tied to AWS or Azure migration, legacy modernisation, systems integration or a change in the operating model across several environments. Continuum Solutions works with cloud infrastructure, custom applications and integrations, including monitoring and debugging with Sentry and New Relic. In that situation, the consultancy should help design the telemetry architecture and playbooks, not merely install an agent.
Continuum Solutions designs and supports AWS and Azure architectures, custom applications, integrations and monitoring practices that connect performance data to real operational decisions. If you're evaluating application performance monitoring during a migration, modernisation or multi-environment rollout, visit Continuum Solutions to discuss a practical architecture and implementation plan.